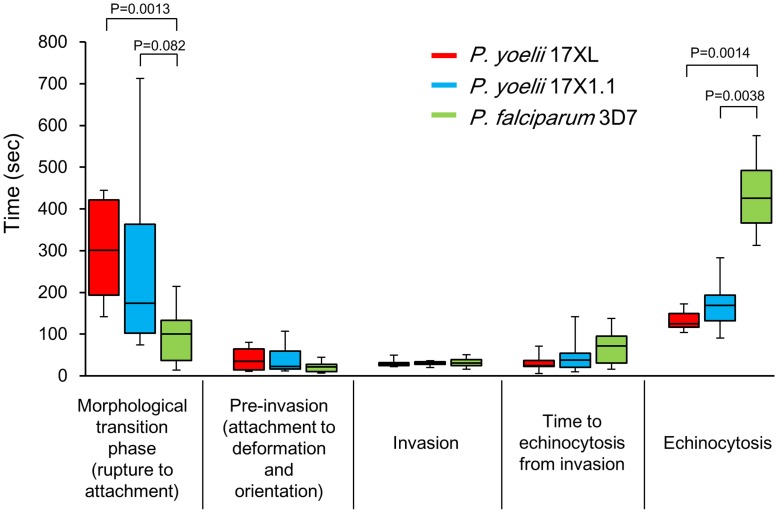
Figure 3. Kinetic difference in red blood cell (RBC) invasion between Plasmodium species.
The median time for each step are shown as a box plot with whiskers from minimum to maximum. The interquartile range shows as box with the median marked as a horizontal line, minimum and maximum from lower and upper quartile represent error bar. P values were determined using the Mann-Whitney U test. See Table S1 for detail values.

