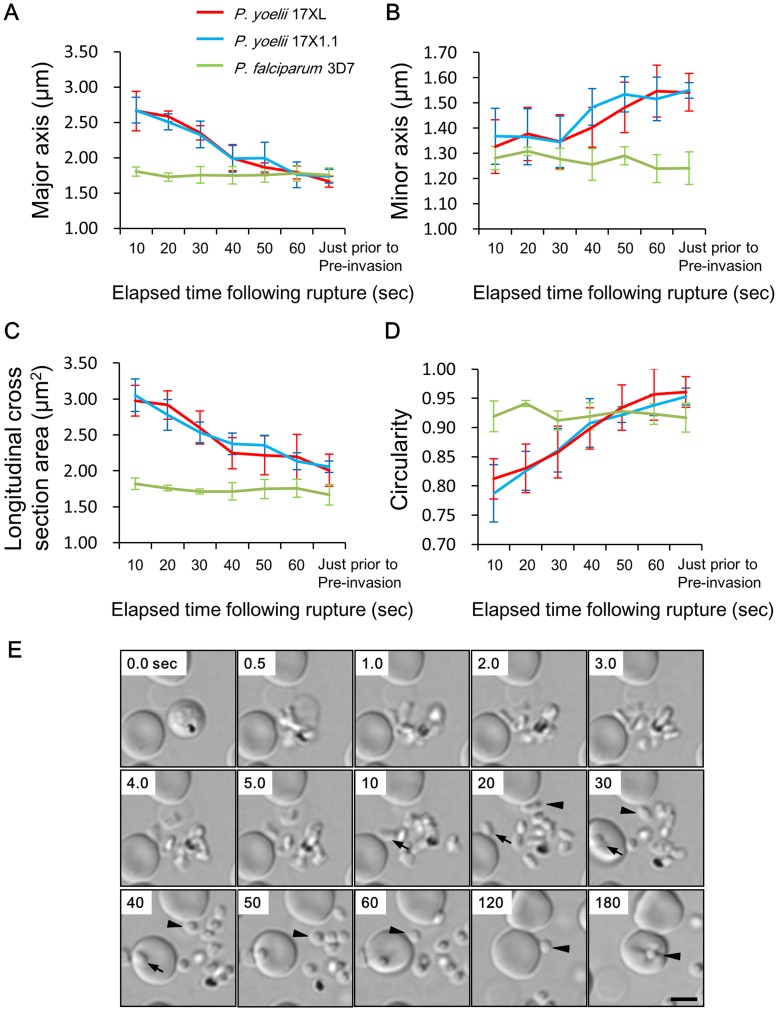
Figure 4. Morphological change of the Plasmodium yoelii merozoite after released from red blood cell (RBC).
The major axis (A), minor axis (B), longitudinal cross section area (C), and circularity (D) were measured every 10 sec from RBC rupture to pre-invasion for invasive merozoites (n = 9–12). The average and the error representing one standard deviation were plotted in the line charts. Circularity was calculated using the following formula: Circularity = 4πArea/Perimeter2. A value of 1 indicates a perfect circle and the value of 0 indicates an increasingly elongated polygon. See Table S1 for detail values. (E) Time-lapse sequence of merozoite release of P. yoelii 17XL was recorded every 0.1 sec. Arrowhead indicates same invasive merozoite in the sequence and the arrow indicates an attachment of an immature flat elongated oval merozoite. A mature spherical invasive merozoite attached to the RBC and deformed RBC (Pre-invasion) at 180 sec. The bar represents 5 µm.

