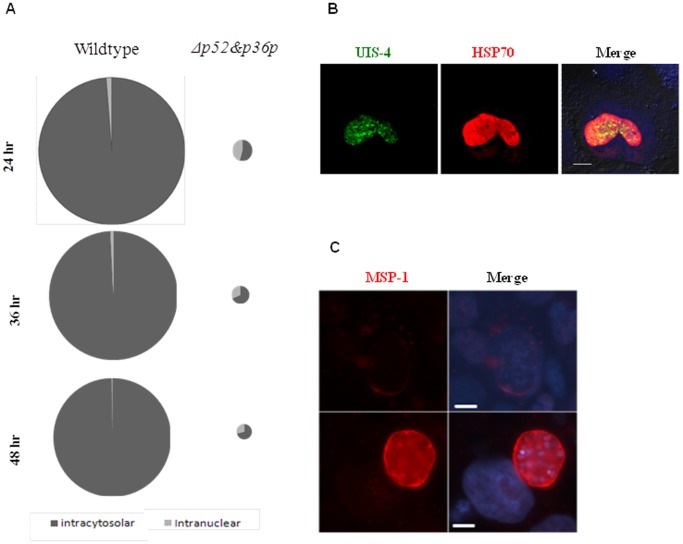
Figure 1. Intranuclear development of Δp52&p36 P. berghei parasites.
A) Pie diagrams of intranuclear and cytosolic wildtype and mutant replicating parasites at 24, 36 and 48 hours post invasion in Huh-7 cells. The diameter of the circles represents the relative number of replicating parasites observed per coverslip, where the wildtype circle at 24 hour represent 100% and all other circles are deduced (wildtype = 1300–1500 and Δp52&p36 = 20–40 replicating parasites per coverslip at 24 hours post infection. Absolute numbers are depicted in Table S1 B) UIS-4 and HSP70 expression on an intranuclear P. berghei parasite 44 hours post infection (Bar = 10 µm). C) MSP-1 expression on intranuclear (Δp52&p36) and cytocolic (wildtype) P. berghei parasites 52 hours post infection (Bar = 10 µm).

