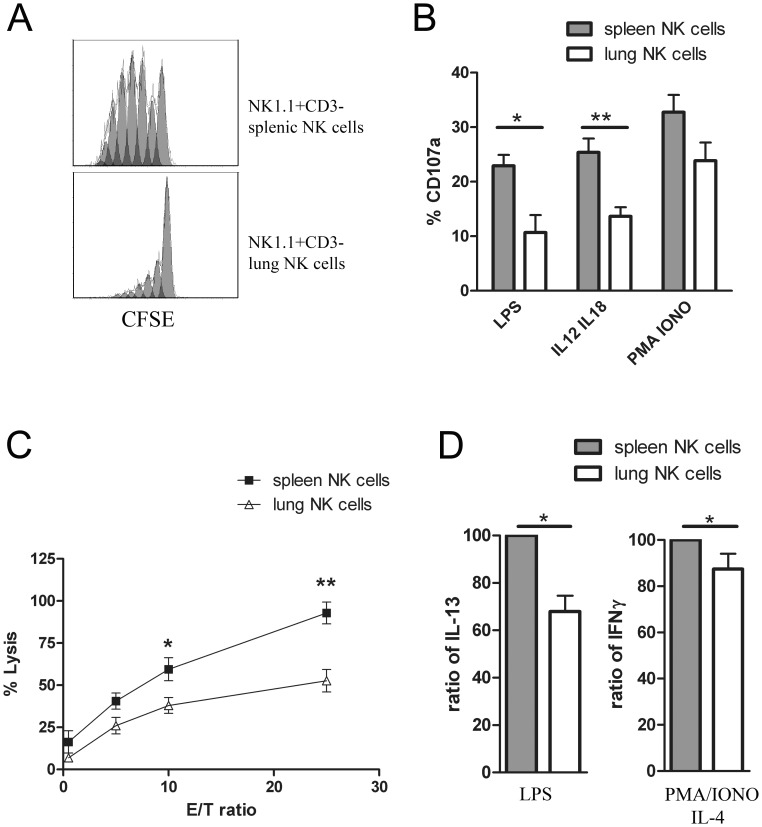
Figure 3. Spleen and lung NK cells have different proliferative and cytotoxic capacity.
(A) Proliferation of 7AAD− NK cells. Splenocytes and lung cells were stained with CFSE and analyzed by flow cytometry after 4 days in culture. From high to low the peaks are showing an additional cell cycle, the highest arbitrary fluorescence unit peak could be cells which didn’t cycle at all. Data are representative of three experiments. (B) Degranulation assay. Spleen and lung NK cells were stimulated with LPS, IL-12/IL-18 or PMA/ionomycin (PMA/IONO). CD3−NK1.1+ NK cells were analyzed for CD107a expression (n = 4). (C) Cytotoxicity assay was performed against YAC-1 target cells (n = 4). The results for each group are expressed as means ± SEM. *p<0.05, **p<0.01. (D) Cytokine levels. IL-13 and IFN-γ were produced by NK cells from the lung and the spleen after stimulation under different conditions: LPS or PMA/ionomycin/IL-4. Results are presented as a ratio of spleen NK cells (100%) to lung NK cells (n = 4). The results for each group are expressed as means ± SEM. *p<0.05.

