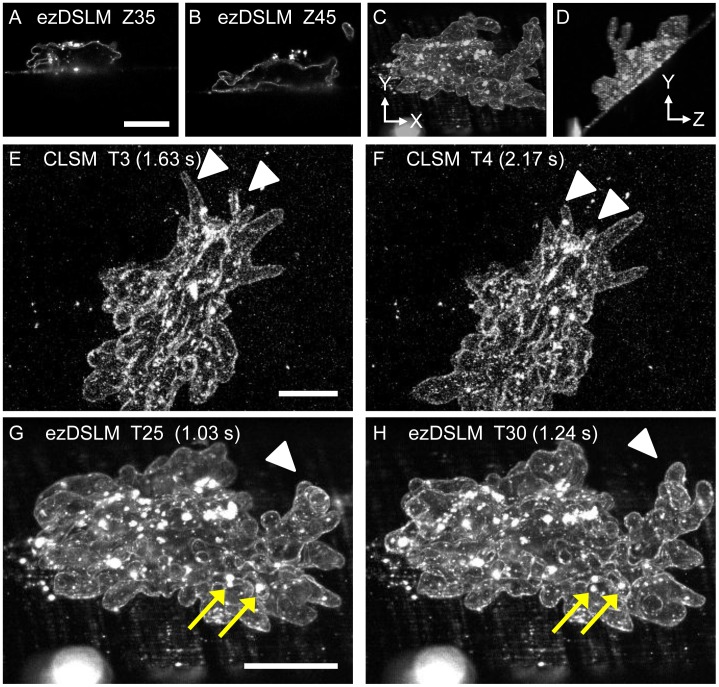
Figure 3. Images of freely moving DiI-labeled amoebae.
Images were obtained using the ezDSLM (A–D, G, H) and CLSM (E, F). (A, B) X–Y optical sections from a Z-stack. Z35 and Z45 indicate slice numbers in Z-stacks with 2.48 µm intervals, i.e., actual distances are 86.8 and 111.6 µm, respectively. A complete series of Z-stack is shown in Fig. S2. (C, D) Front (C) and side (D) views of a reconstructed three-dimensional image. (E, F) Max projection images of Z-stacks at time-points T3 (E) and T4 (F) from time-lapse images obtained using CLSM. Intervals for each time-point were 0.54 s. It is difficult to follow the changes in shapes (arrowheads). (G, H) Max projection images from Z-stacks at time points T25 (G) and T30 (H) from time-lapse images obtained by ezDSLM. Intervals for each time-point were 0.04 s. Extensions of protrusions (arrowheads) and traceable clusters of dye (arrows) are depicted in detail. Note that the four more images (T26–T29) are present between these time points (not shown). Scale bars, 50 µm.

