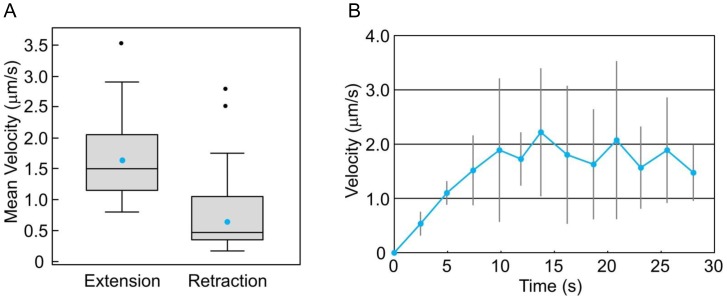
Figure 4. Dynamics of protrusions during amoeboid movements.
By using the images obtained by ezDSLM, velocities of extending or retracting protrusions were measured. (A) Mean velocities of protrusions during extension or retraction are shown in box plots. Blue and black dots indicate mean values and outliers, respectively. The mean velocities of extension and retraction were significantly different by t-test (p<0.01). Data from 25 protrusions for each category are shown. (B) Time-evolved velocities of extending protrusions. Data from 5 protrusions are shown as mean±SD.

