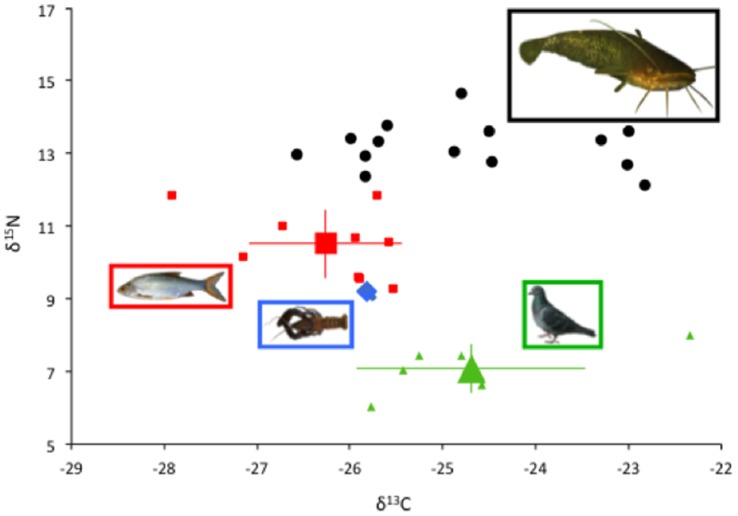
Figure 2. Stable isotope values of European catfish and the putative prey.
δ13C and δ15N values (‰) of each individual (n = 14) and the putative aquatic (fish, n = 9 and crayfish, n = 3) and terrestrial (pigeon, n = 6) prey are displayed. The large symbols for each prey represent the mean value (± SD).

