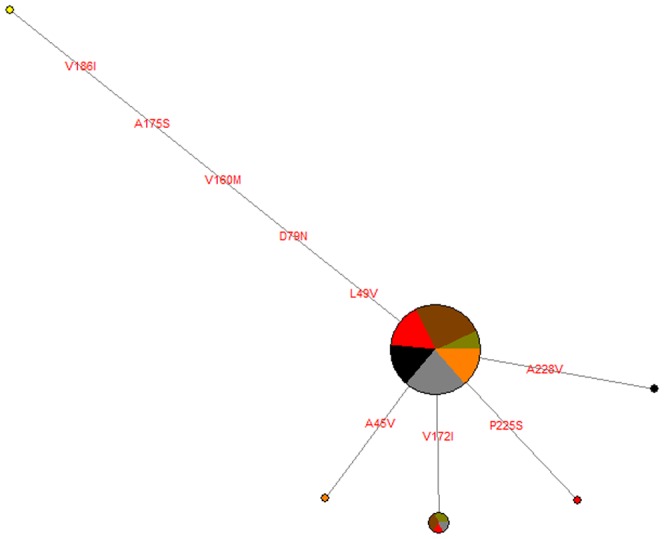
Figure 2. MC1R non-synonymous variants network for 120 haplotypes from Z. borbonicus and Z. mauritianus.

This is a median-joining network. Circles represent variants with areas proportional to their sample sizes. Each branch represents a single substitution with amino-acid position indicated. Proportions of individuals of each locality are indicated by pie charts for each haplotype (black: Z. mauritianus, light brown: lowland brown morph, dark brown: highland brown morph, grey: grey morph, orange: grey-headed brown morph, red: grey-headed brown-naped brown morph, yellow: outgroup, Zosterops japonicus).
