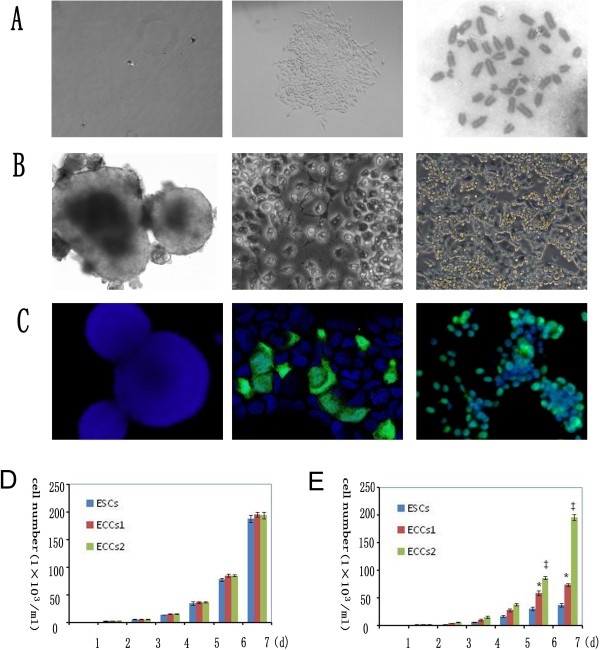
Figure 2.
ESCs, ECCs1 and ECCs2 in DMEM supplied with 10% FBS. (A) tumor-derived cells seeded as single cells (left) Single cell-formed ECCs2 clone (middle), ECCs2 maintained normal karyotype at early passage(right). (B) ESCs (left), ECCs1 (middle) and ECCs2 (right) in DMEM supplied with 10% FBS. (C) Immunostaining of Oct4 (green) and DAPI (blue) of ESCs (left), ECCs1 (middle) and ECCs2 (right). (D) Growth curve of ESCs, ECCs1 and ECCs2 in 2i medium. (E) Growth curve of ESCs, ECCs1 and ECCs2 in DMEM supplied with 10% FBS. *,P < 0.05 versus ESCs;‡, P < 0.05 versus ESCs and versus ECCs1. Each point represents a mean of triplicate values for each sample ± SD.

