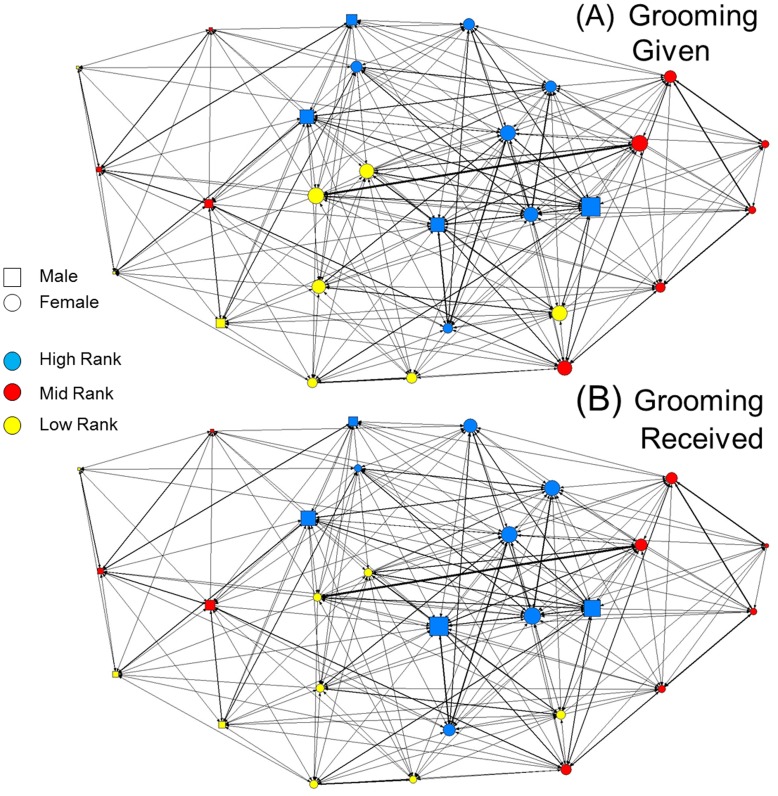
Figure 1. Sociograms illustrating the global social network (all seasons included) based on all recorded grooming given and received from a group of Yakushima macaques between October 2007 and August 2009.
Nodes represent individuals, with the size of the node representing the outward and inward eigenvector centrality scores for A and B, respectively. Node colour represents the three rank classes used in this study. Edges (lines) between individuals are weighted by strength, such that thicker lines indicate stronger grooming relationships. Arrow heads are also weighted by strength to indicate the magnitude and direction of grooming behaviour. Note that the degree of bias toward high ranking individuals is considerably stronger in the grooming received network, as indicated by larger discrepancies between the sizes of the nodes for each rank.

