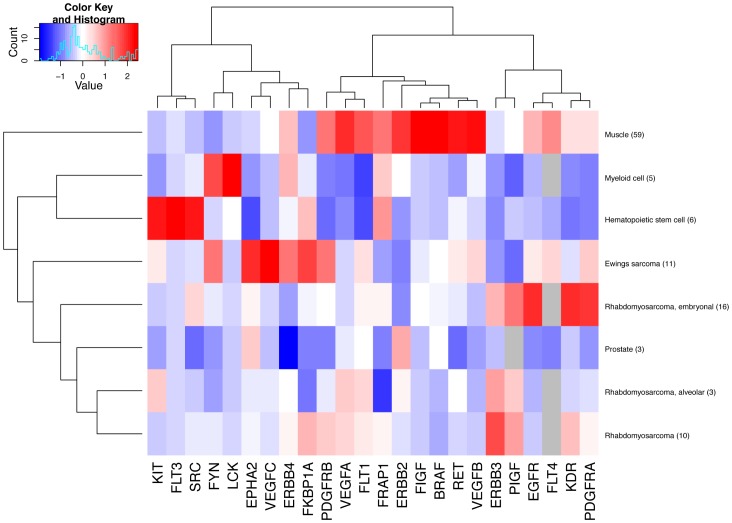
Figure 1. Hierarchial clustering of validated therapeutic target genes in rhabdomyosarcomas and Ewing’s sarcomas.
The red boxes illustrate mRNA expression levels exceeding the mean expression per gene in the analyzed tissues, whereas the blue boxes illustrate mRNA expression levels lower than the mean expression per gene. The number of samples analyzed per tissue type is given in parentheses.

