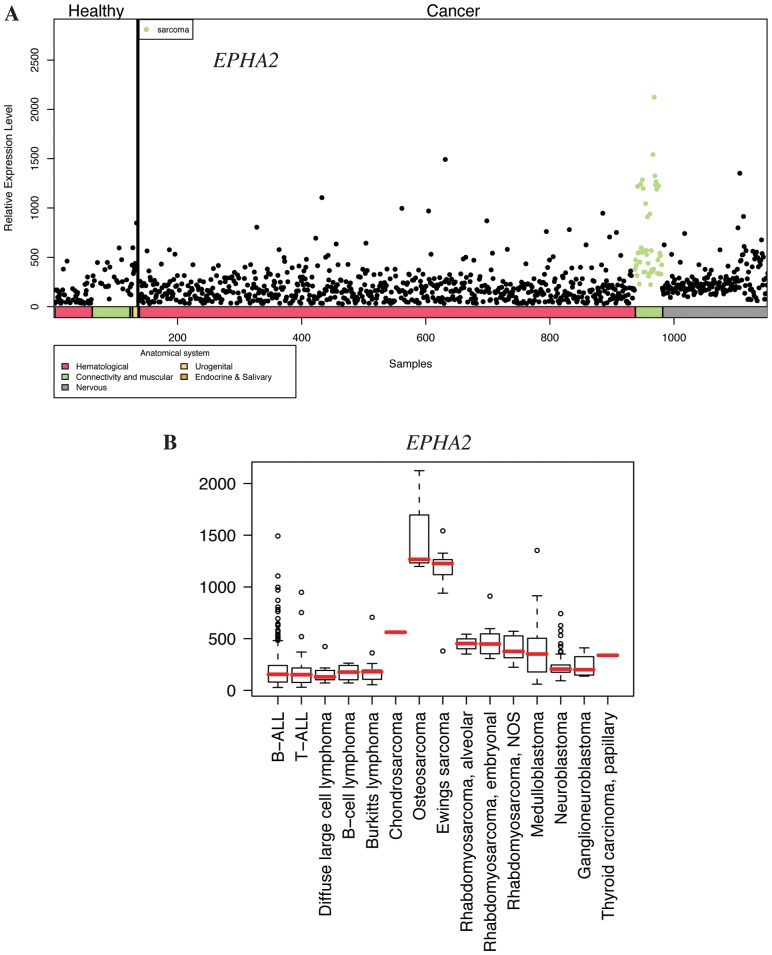
Figure 2. Expression profile of EPHA2 in pediatric healthy and cancer tissues. A.
) Body-wide expression profile of the EPHA2 gene across the database. Each dot represents the expression of EPHA2 in one sample. Anatomical origins of each sample are marked in color bars below the gene plot. The EPHA2 gene is highly expressed in malignant connective and muscular tissue samples (green dots). B) Box plot analysis of the EPHA2 gene expression levels across a variety of pediatric cancer samples. EPHA2 is particularly highly expressed in osteosarcoma and Ewing’s sarcoma. NOS, not otherwise specified.

