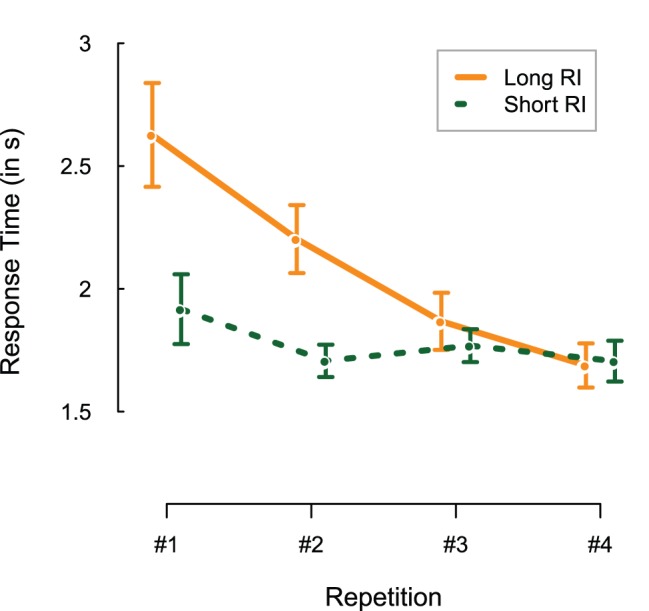
Figure 4. Response latencies per repetition, plotted separately for the long (orange, solid) and short (green, dashed) retention interval (RI) sets.

Error bars represent 1 standard error of the mean.

Error bars represent 1 standard error of the mean.