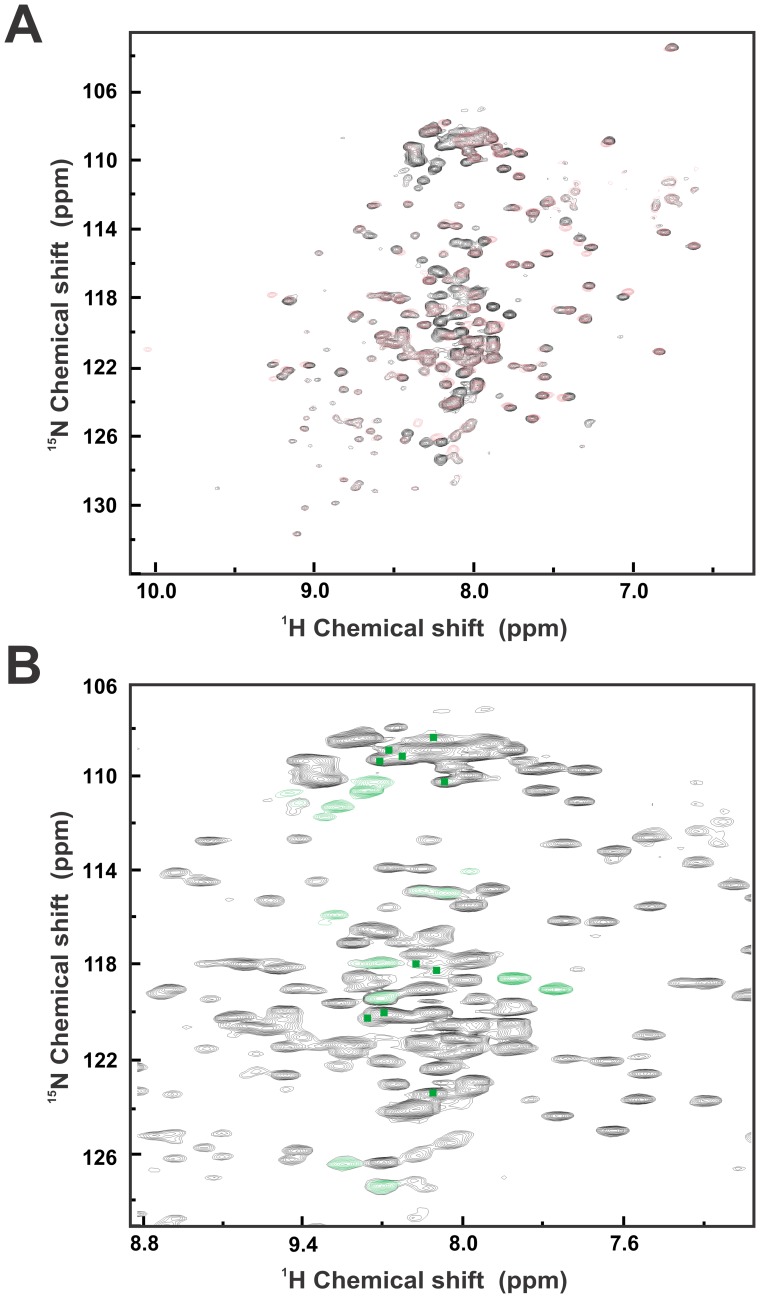
Figure 7. NMR experiments for Sis1 and Sis1_Δ124–174.
(A) Superimposed TROSY NMR spectra of Sis1 (black signals) and Sis1_Δ124–174 (red signals) showing that Sis1_Δ124–174 presents less signals, all of them in the central region of the TROSY spectrum with chemical shifts around 8.2. (B) Zoom of the 2D 1H 15N chemical shifts of Sis1 showing the crosspeaks (marked in green) which are present in the wild-type Sis1 spectra but absent in the Sis1_Δ124–174 spectra. The NMR experiments suggest that the deleted region of Sis1 is intrinsically disordered.

