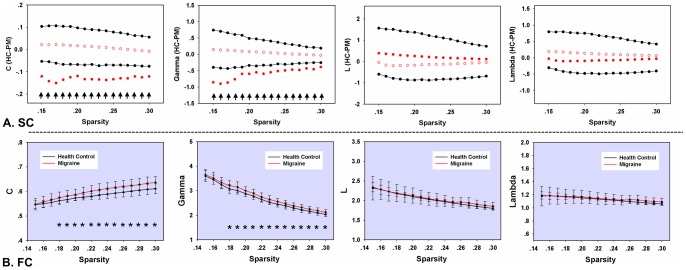
Figure 2. Between-group differences in the mean clustering coefficient C, normalized clustering coefficient gamma, the shortest path length L, and normalized shortest path length lambda over a range of sparsity values.
(A) Differences between the HC and PM groups in subjects' structural networks. The black solid points represent the 99% confidence intervals of the between-group differences obtained from 5000 permutation tests at each sparsity value. The red open circles describe the mean values and the red solid points indicate significant between-group differences in network metrics. (B) Differences between the HC and PM groups in the subjects' functional networks. The red lines represent the network metrics in the PM. The black lines describe the network metrics in the HC. The horizontal stars indicate the significant between-group differences (p<0.01, FDR corrected).

