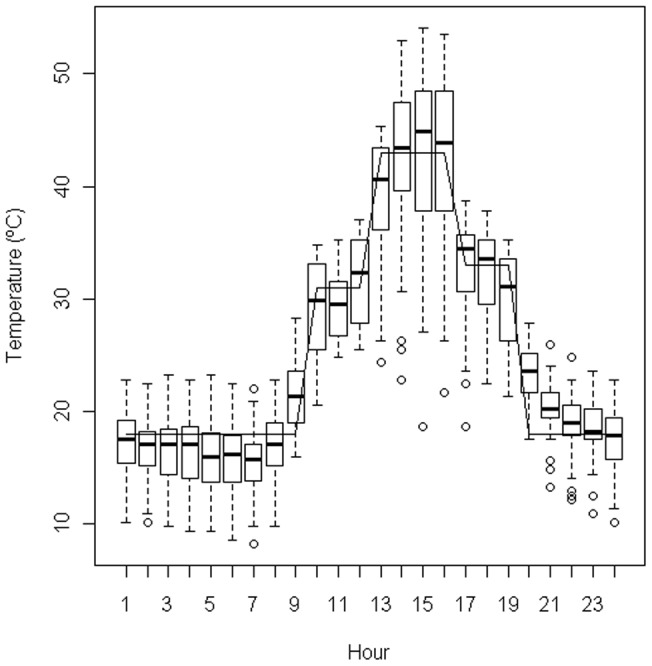
Figure 1. Hourly register of daily temperature (°C) observed during summer on the bare soil surface of a fire-break (with no slash).

Data from a typically Mediterranean fire-prone area (August 1998, Valencia, eastern Spain [16]). Boxplots represent daily variability in temperature for each hour (n = 28 days). Dashed vertical lines represent the data within 1.5 interquartile range, and open circles are values outside this range (outliers). The continuous line represents the treatment applied to simulate summer temperatures.
