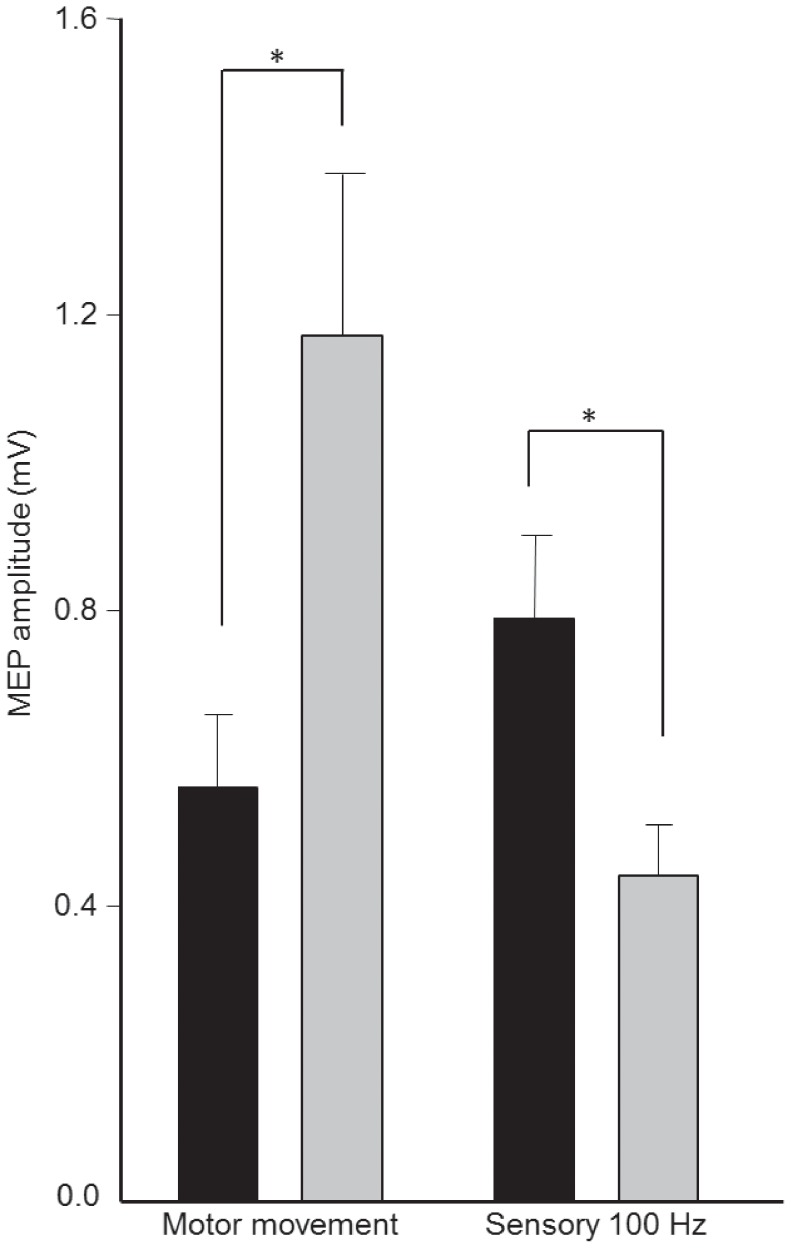
Figure 2. Group data (mean ± standard error) of amplitudes motor evoked potentials (MEP) before (black bars) and after (grey bars) “Motor Movement” and “Sensory 100 Hz” peripheral electrical stimulation (PES) to right abductor pollicis brevis muscle (APB).
MEP amplitude increased following Motor Movement PES and reduced following Sensory 100 Hz PES. * p<0.05.

