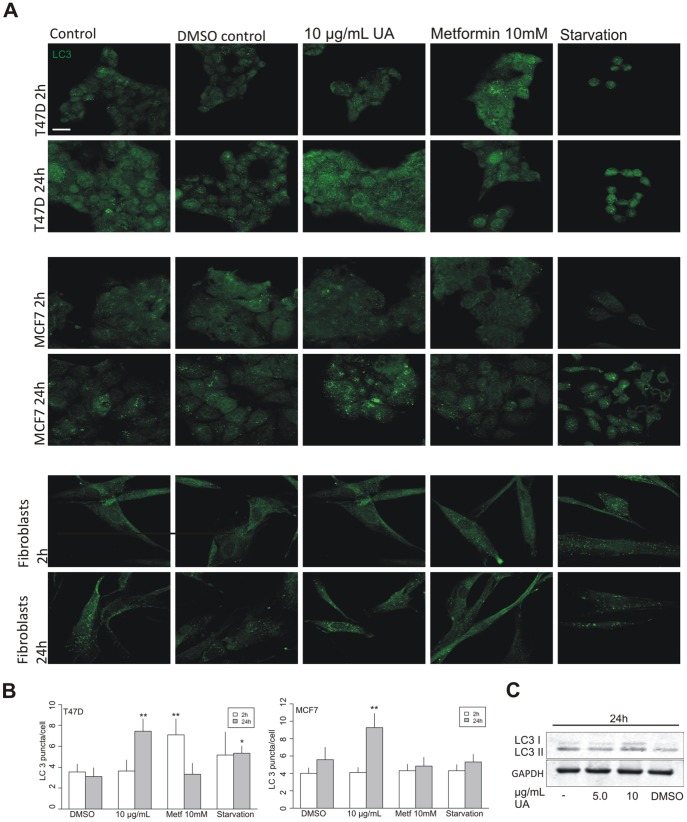
Figure 3. UA induced formation of LC3 puncta.
(A) An increase in LC3 puncta was detected, by immunofluorescence in T47D and MCF7 cells after treatment with UA (10 µg/mL) for 24 hours. No effect was seen in normal fibroblasts. The scale bar shown represents 20 µm and applies to all panels. (B) LC3 puncta per cell were counted and quantified by ImageJ and data represented as LC3 puncta/cell of each group compared with DMSO control. Error bars indicate standard error of the mean, *p<0.05, **p<0.001. (C) Increase in LC3 I and LC3 II, verified by Western blotting, was detected in T47D cells after treatment with UA (10 µg/mL; DMSO 0.2%) for 24 hours.

