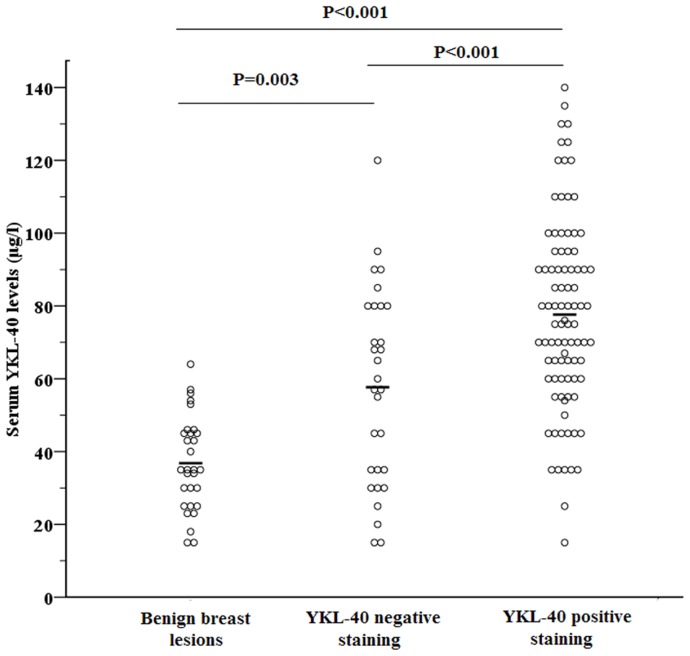
Figure 2. Individual concentrations of serum YKL-40 in the controls (n = 30), and breast cancer patients who were YKL-40 negative (n = 30) or YKL-40 positive by IHC (n = 90).
Bold lines indicate the mean of each subgroup. (control: 36.8±12.9 µg/l; YKL-40 negative staining: 56.7±26.9 µg/l; YKL-40 positive staining: 77.6±26.3 µg/l). P-value was derived from one-way ANOVA with a post-hoc Bonferroni comparison for comparing the difference in YKL-40 concentration among groups.

