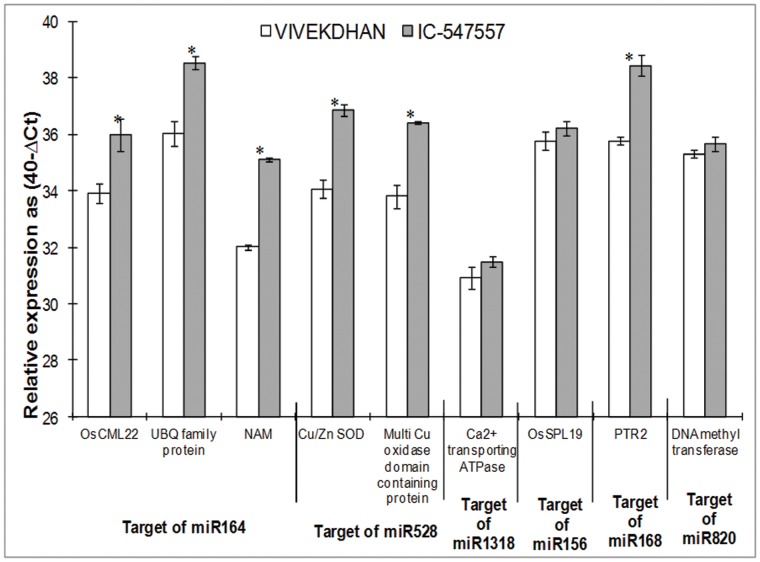
Figure 6. Expression profiling analysis of several target genes in the roots of low-N tolerant (IC-547557) and low-N sensitive (Vivek Dhan) rice genotypes under low-N condition.
The expression levels of miRNAs were normalized to the level of actin. Expression levels are given on a logarithmic scale expressed as 40−ΔCT, where ΔCT is the difference in qRT-PCR threshold cycle number of the respective miRNA and the reference actin gene; therefore, 40 equals the expression level of actin gene (the number 40 was chosen because the PCR run stops after 40 cycles). The results are averages ± SE of duplicates of three biological replicate. Significance of the changes between IC-547557 and Vivek Dhan under N-limitation was checked with Student’s t-test at the level of p≤0.05. The significant expression difference between the two genotypes is shown as asterisk.

