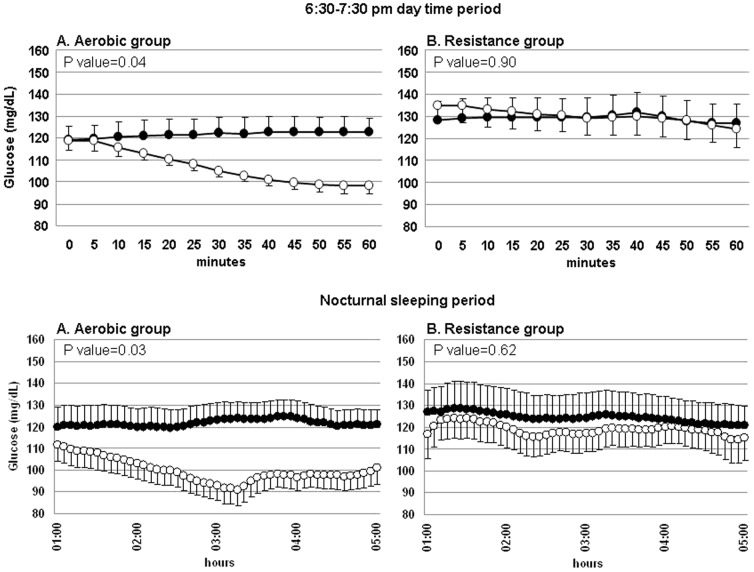
Figure 3. Mean glucose concentrations behavior during selected periods, in the aerobic (A) and the resistance (B) groups.
Upper panels: glucose concentrations during the 60-min exercise session and the corresponding period of the non-exercise day. Lower panels: glucose concentrations during the nocturnal sleeping period (01:00–05:00 am) of the two days. White circles indicate glucose values in the exercise day, and black circles those in the non-exercise day. P values refer to differences in glucose concentration AUCs between the exercise day and the non-exercise day.

