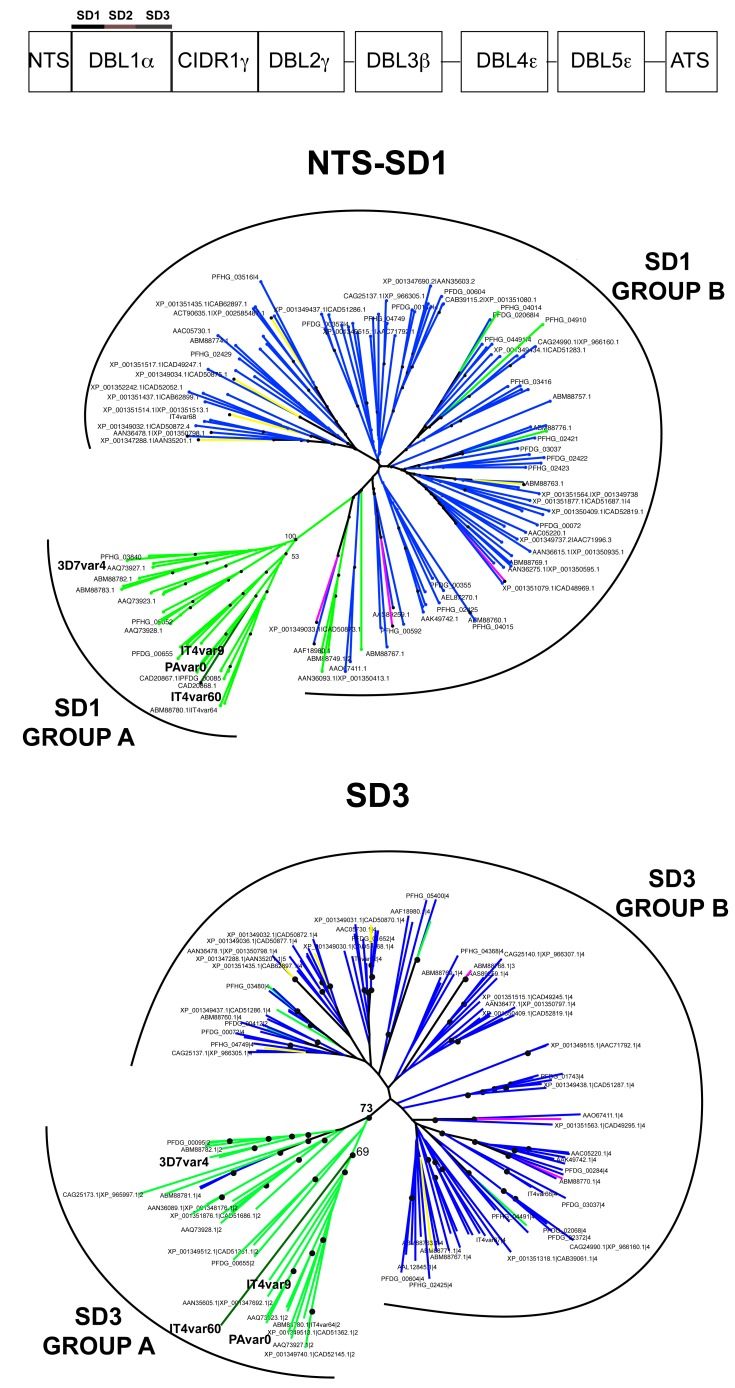
Figure 5. Phylogenetic tree of NTS-SD1 and SD3 sequences.
The Neighbor Joining tree shows segregation of the NTS-SD1 (considered from h1 to LARSFADIG) and SD3 (considered from h6 to h7) in two groups. Bootstrap support, after 1000 replicates, is only shown for the branches separating different groups, black dots at nodes indicate bootstrap values above or equal to 50%. 1-cys sequences are colored in dark green, 2-cys in green, 3-cys in pink, 4-cys in blue and 5-cys in yellow.

