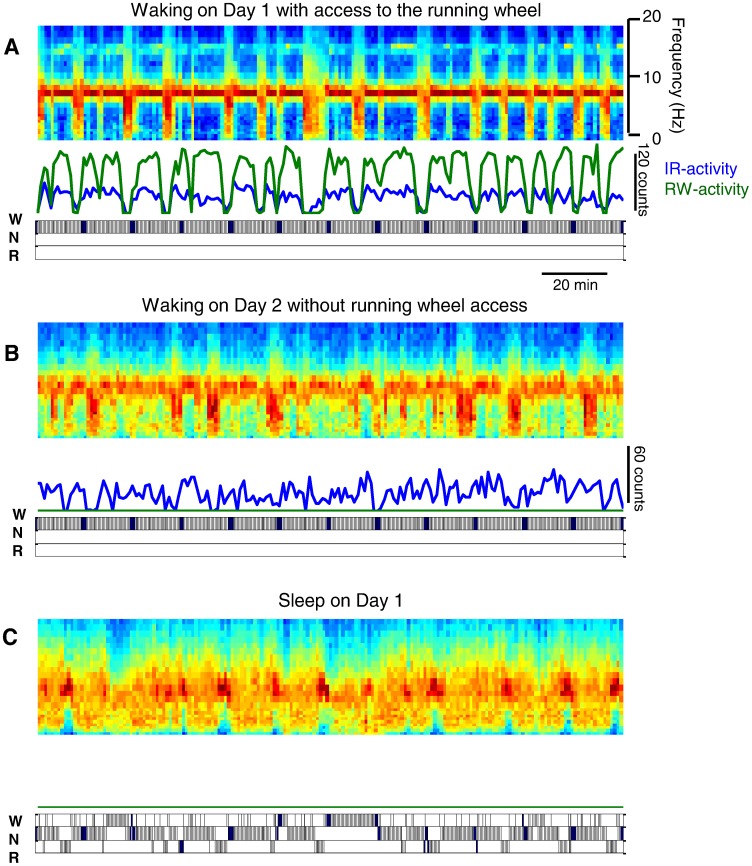
Figure 4. Temporal structure of behaviour and brain activity.
A periodic structure is manifested on all three days: in brain EEG activity on the day with access to the running wheel (A), during waking without access to the running wheel on Day 2 (B) and during sleep on Day 1 (C). Each panel depicts a 3-h interval (panels A and B: beginning 1.5 hours after dark onset on Day 1 and 2 respectively; panel C: 5 h after light onset on Day 1), for which the spectrogram of the occipital EEG was computed (top in each panel), along with the IR- and RW-activity (middle in each panel). The three vigilance states, waking (W), NREM sleep (N) and REM sleep (R) are shown in the hypnograms below each panel. Note that the overall amplitude of changes during spontaneous waking on Day 2 was lower than on Days 1 or 3 (the scaling on the color plots in Fig. 5 is adjusted to the maximal values).

