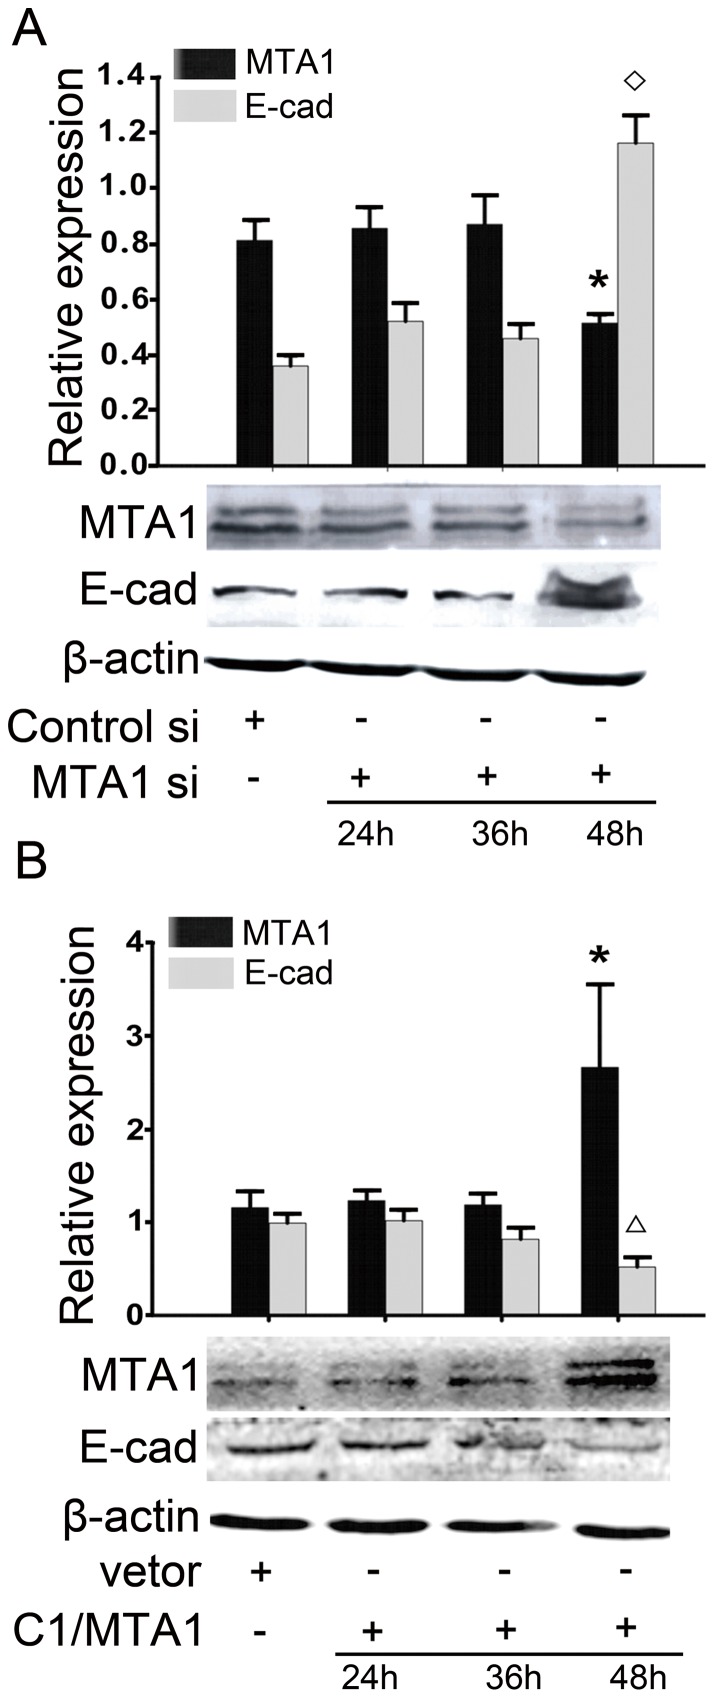
Figure 3. MTA1 regulates E-cadherin expression.
(A) Western blotting results demonstrated that treatment with MTA1 siRNA increased E-cadherin expression after 48 hours. An asterisk (*) or diamond (◊) indicates a statistically significant difference (p<0.05) in the MTA1 or E-cadherin levels, respectively, compared with the negative-control siRNA-transfected cells. (B) A Western blotting analysis also demonstrated that transient transfection with a plasmid that encoded full-length MTA1 decreased E-cadherin expression after 48 hours. An asterisk (*) or diamond (◊) indicates a statistically significant difference (p<0.05) in the MTA1 or E-cadherin levels, respectively, compared with the cells transfected with an empty vector. The changes were quantified (top). All of the experiments were repeated three times.

