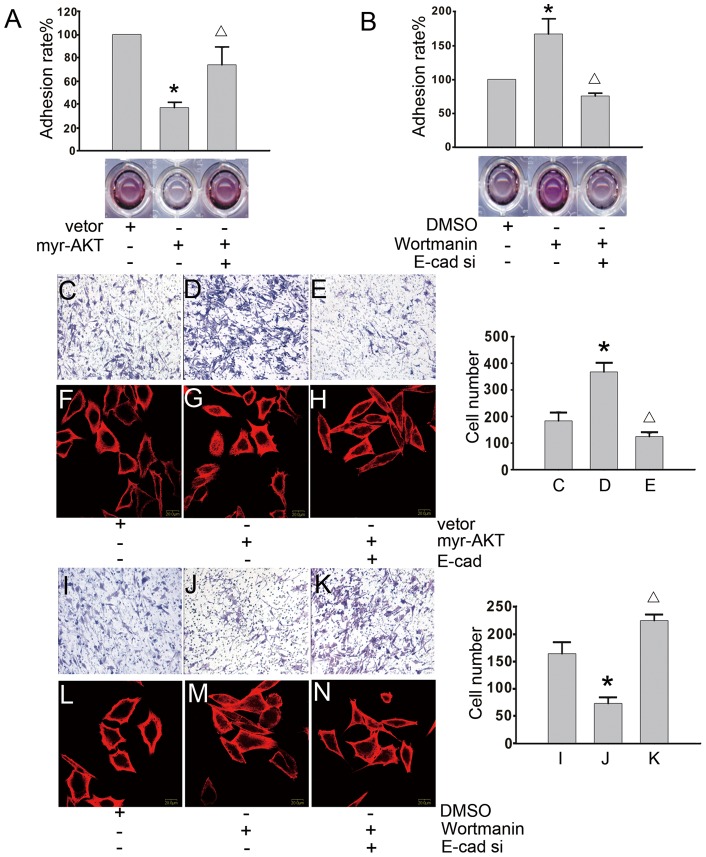
Figure 5. The forced over-expression or silencing of E-cadherin changes the p-AKT mediated malignant phenotypes.
(A) The cells were treated with the myr-AKT plasmid or empty vector for 48 hours in the presence or absence of E-cadherin siRNA. The adhesive ability was tested using the MTT assay, and a typical experimental result is shown. An asterisk (*) indicates a statistically significant difference (p<0.05) compared to the cells transfected with an empty vector. A triangle (Δ) indicates a statistically significant difference (p<0.05) compared to the cells transfected with the myr-AKT-encoding plasmid in the absence of E-cadherin siRNA. (B) The cells were incubated with wortmannin (100 nM) or DMSO for 24 hours and then treated with or without E-cadherin siRNA for 48 hours. Using the MTT assay, the adhesive ability of the cells was tested. An asterisk (*) indicates a statistically significant difference (p<0.05) compared with DMSO-treated cells. A triangle (Δ) indicates a statistically significant difference (p<0.05) compared with the wortmannin-treated cells in the absence of E-cadherin siRNA. (C, D, and E) The cells were treated with the myr-AKT plasmid or an empty vector for 48 hours in the presence or absence of the E-cadherin plasmid. A MatrigelTM-coated transwell system was used to analyze the invasive capabilities of the cells. The quantification of the number of invasive cells from the bottom of the transwell inserts is shown (right panel). An asterisk (*) indicates a statistically significant difference (p<0.05) compared to the cells transfected with an empty vector. A triangle (Δ) indicates a statistically significant difference (p<0.05) compared with the cells transfected with a myr-AKT-encoding plasmid in the absence of E-cadherin siRNA. (F, G, and H) The cells were treated with the myr-AKT plasmid or an empty vector for 48 hours in the presence or absence of the E-cadherin plasmid. The changes in the cellular cytoskeleton were monitored by confocal microscopy. Red staining represents α-tubulin, and blue staining represents the nuclei (400 fold). (I, J, and K) The cells were treated with wortmannin (100 nM) or DMSO for 24 hours and then treated with or without E-cadherin siRNA for 48 hours. A MatrigelTM-coated transwell system was used to measure changes in the cellular invasive ability. The quantification of the number of invasive cells from the bottom of the transwell insert is shown (right panel). An asterisk (*) indicates a statistically significant difference (p<0.05) compared to the DMSO-treated cells. A triangle (Δ) indicates a statistically significant difference (p<0.05) compared with the wortmannin-treated cells in the absence of E-cadherin siRNA. (L, M, and N) The cells were treated with wortmannin (100 nM) or DMSO for 24 hours and then treated with or without E-cadherin siRNA for 48 hours. The changes in the cellular cytoskeleton were monitored by confocal microscopy. Red staining represents α-tubulin, and blue staining represents the nuclei (400 fold). A representative result from three experiments is shown for all data.

