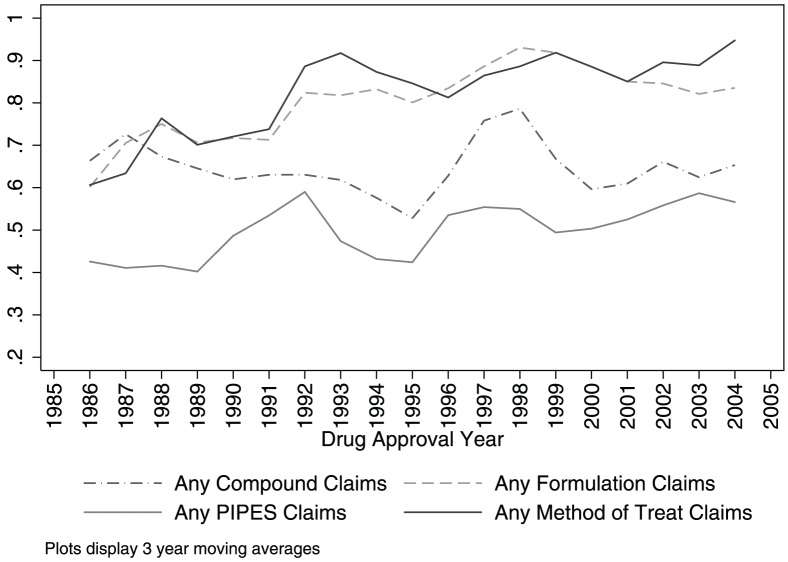
Figure 1. Share of drugs with chemical compound and secondary patent claims by approval year (three year moving averages).
Based on the 432 new molecular entities (with at least one patent) approved by the U.S. Food and Drug Administration between 1985 and 2005. Categories are based on authors' coding of the claims from the 1304 patents (1261 distinct patents) associated with these drugs. “PIPES” refers to Polymorph, Isomer, Prodrug, Ester, and Salt claims. The horizontal axis is drug approval year. The vertical axis measures the moving average of the share of drugs in an approval year with at least one patent in a category.

