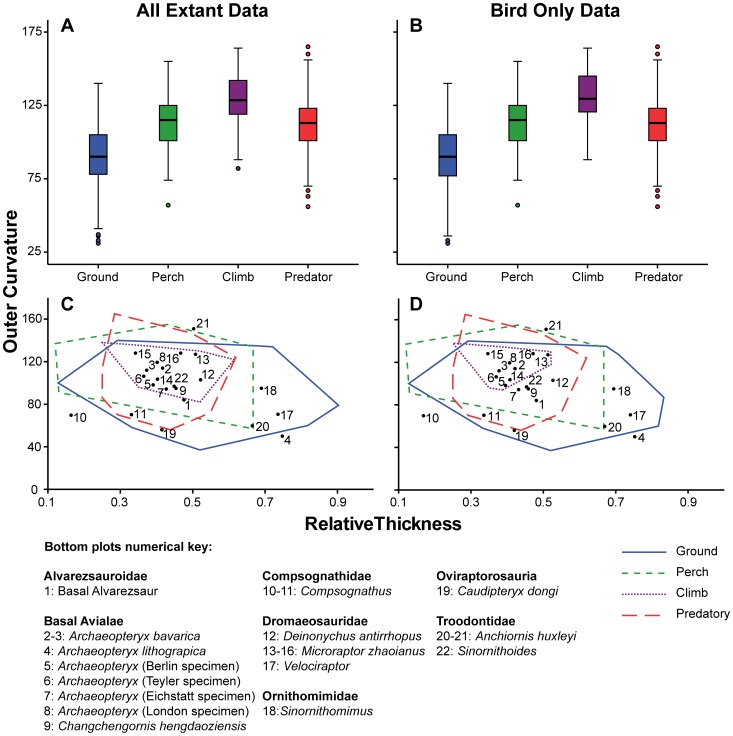
Figure 4. Outer claw curvature, digit III, for all extant taxa and Mesozoic theropods.
Box plots for outer claw curvature distinguished by behavioural category for (A) all extant taxa, (B) extant birds only. Shaded boxes depict the interquartile range (IQR) with median marked as the horizontal line. The whiskers indicate the distance between the IQR and points up to 1.5 distances from the IQR. Outliers are represented as circles and are between 1.5 and 3 distances from the IQR. Outer claw curvature plotted against relative midpoint height, overlain with Mesozoic theropod data for (C) all extant taxa, (D) extant birds only.

