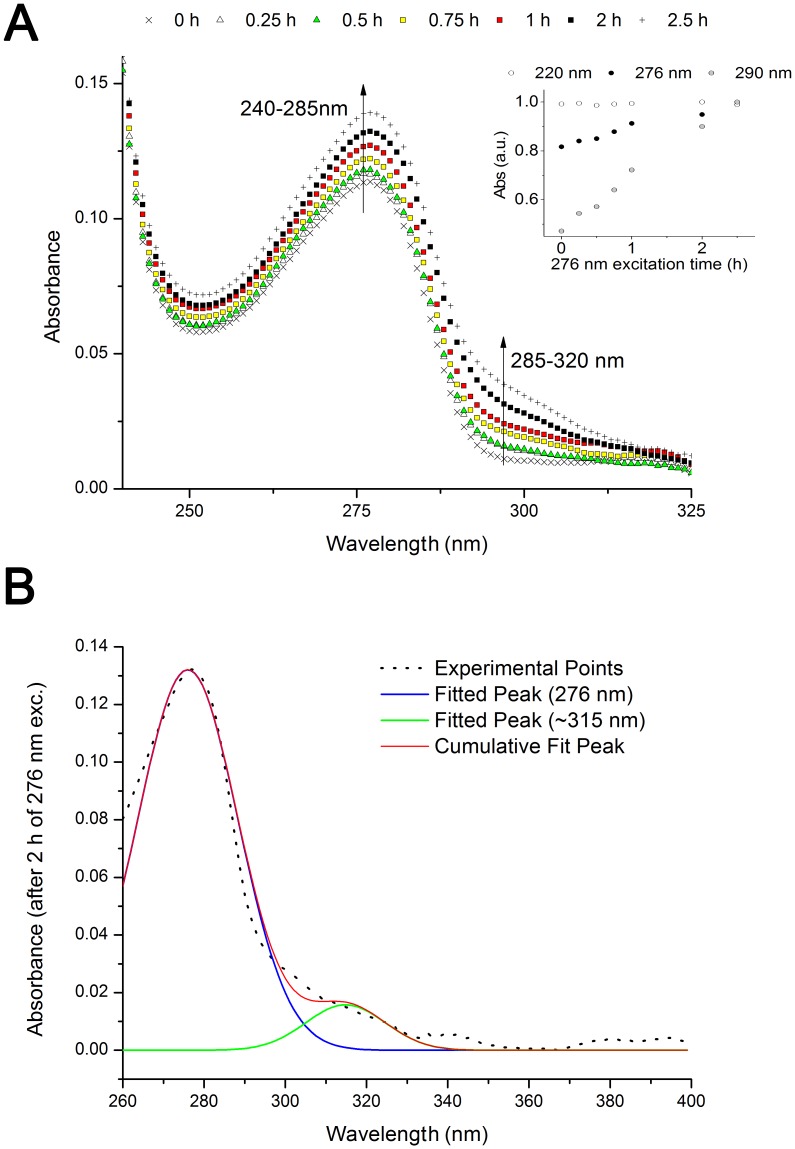
Figure 3. Absorbance spectra of human insulin after prolonged 276 nm UV-excitation.
(A) Absorbance spectra obtained before and after 276 nm light continuous exc. (0.25 h, 0.5 h, 0.75 h, 1 h, 2 h, and 2.5 h) of human insulin in solution. In the insert, are plotted the absorbance values at 220, 276 and 290 nm vs 276 nm exc. time. Absorbance at 276 and 290 nm increase linearly with 276-nm excitation time (linear fitting, R2 = 96.78% for Abs276 nm and R2 = 99.28% for Abs290 nm). (B) Fitting of the absorbance spectrum (obtained after 2 h exc. with 276 nm light) with a 2 gaussian peak function. The peak at 276 nm was fixed. The original experimental spectrum, the two individual fitting curves obtained for each peak and the cumulative curve of the two fittings are displayed.

