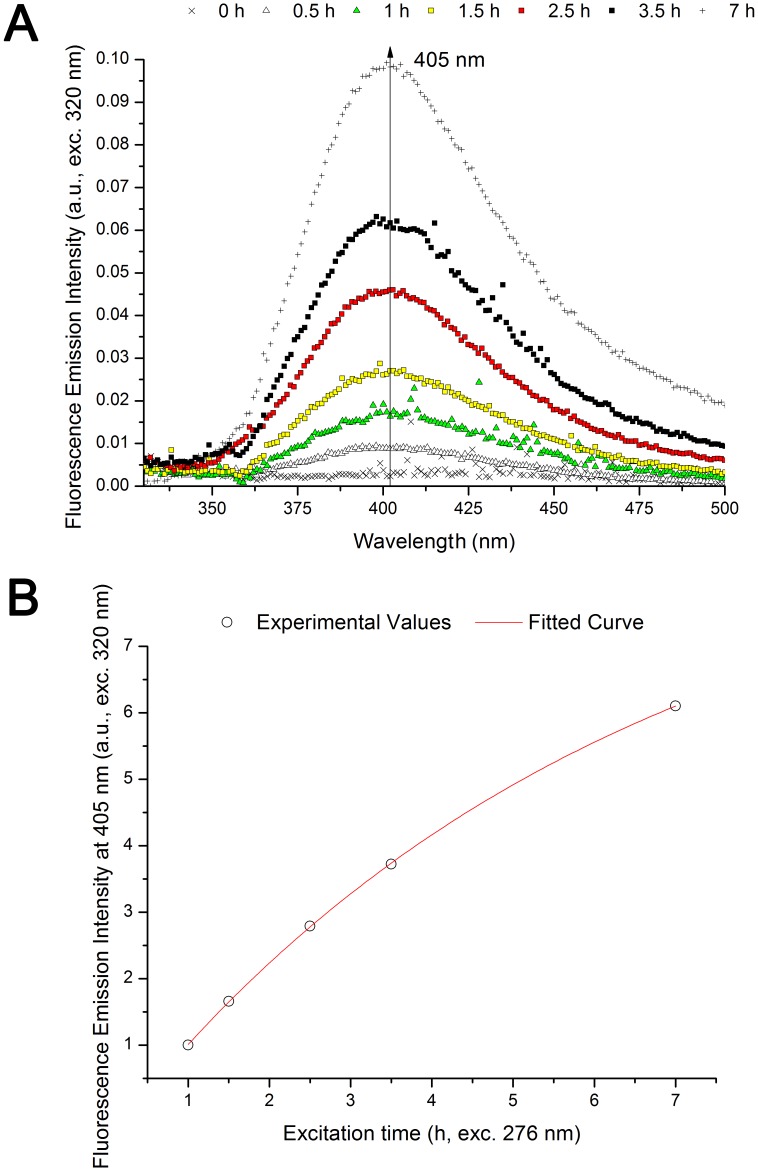
Figure 5. Fluorescence emission of human insulin (320 nm excitation) upon prolonged 276 nm UV-excitation.
(A) Fluorescence emission spectra (320 nm exc.) recorded before and after 276 nm light continuous exc. (0.5 h, 1 h, 1.5 h, 2.5 h, 3.5 h, and 7 h) of human insulin in solution. There is a continuous increase in emission intensity at 405 nm with 276 nm exc. time. (B) Fluorescence emission intensity kinetic trace obtained at 405 nm (exc. at 320 nm) upon continuous of human insulin with 276 nm light. Fitting of the experimental traces was carried out using an exponential function F(t) = C1– C2.e −kt. Fitted parameter values and corresponding errors, and root mean square error values were obtained after fitting each kinetic trace (Table 2).

