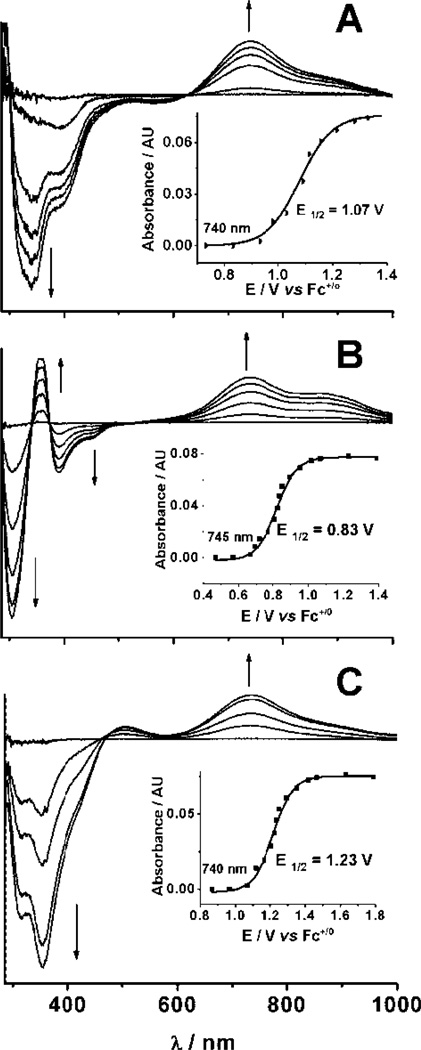
Figure 3.
Difference spectra derived from spectropotentiometric titrations for complexes 2 (A), 3 (B), and 5 (C)at 25 °C in CH3CN containing 0.1 M H2O. The iron concentration used for all three experiments was 0.25 mM. For each panel, the increase in the absorbance at ~740 nm is plotted as a function of the applied potential to show a sigmoidal shape that can be fit well with the Nernst equation.

