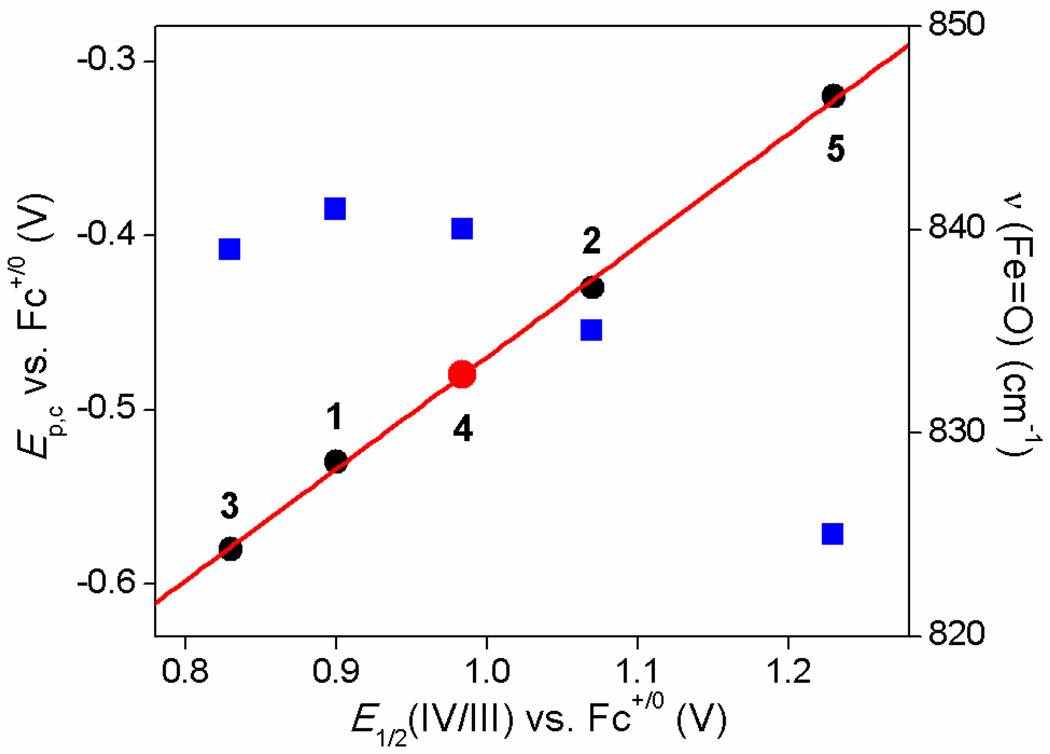
Figure 4.
Plot of Ep,c (black circles) and ν(Fe=O) values (blue squares) versus E1/2(IV/III) vs. E1/2(IV/III) for the FeIV=O complexes in this study (data from Tables 2 and 1, respectively). The red line represents the best linear fit for the Epc vs. E1/2(IV/III) correlation with the red dot indicating an estimation of the E1/2(IV/III) value for 4 from the linear correlation.

