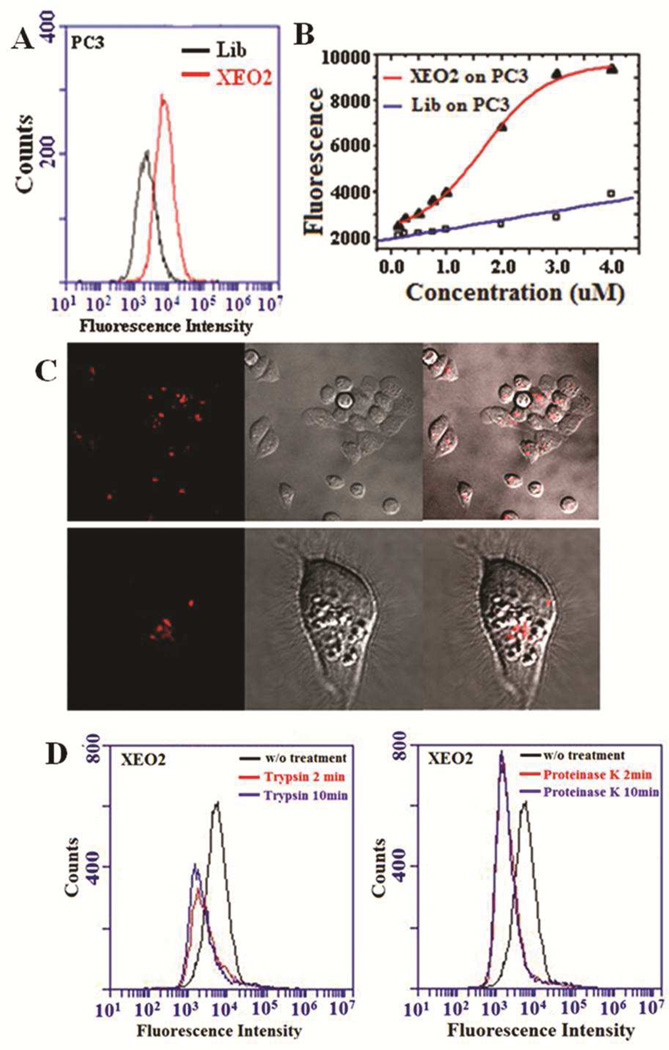
Figure 3.
Internalization of Apt XEO2. A) Representative flow cytometric profiles showing XEO2 internalization signals in PC3 cells. The black curve represents the background uptake of unselected initial library. B) Uptake efficiency of XEO2 by PC3 Cy3-labeled XEO2 was incubated with target cells at different concentrations. Fluorescence signals from inside cells were determined by flow cytometry. C) Representative confocal images showing the distributions of Cy3-labeled XEO2 inside PC3 cells. Left: fluorescence image; middle: widefield image; right: overlay of fluorescence and widefield images. D) Effects of trypsin (left) and proteinase K (right) treatment on the binding of XEO2. The PC3 cells were pre-treated with trypsin or proteinase K for 2 or 10 min before incubation with the Apts.

