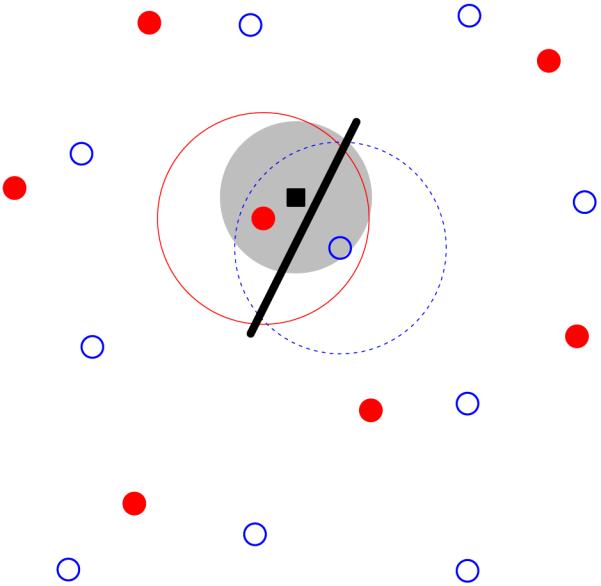
Figure 1.

Overview of the statistical wiring model. The receptive field midpoints of on- and off-centre RGCs (filled red circles and open blue circles respectively) are arranged in semi-regular mosaics. A regular array of cortical neurons (one shown as black square) is overlaid on top of this population. A cortical unit receives input from RGCs whose receptive field centres are within a given range (large filled grey circle) of the cortical neuron, inversely proportional to the lateral distance from the cortical neuron. This cortical unit receives strong input from one on-centre and one off-centre RGC. These RGCs have Gaussian receptive field profiles (large circles surrounding the two RGCs); the cortical unit thus has an oriented receptive field summarised by the thick black line.
