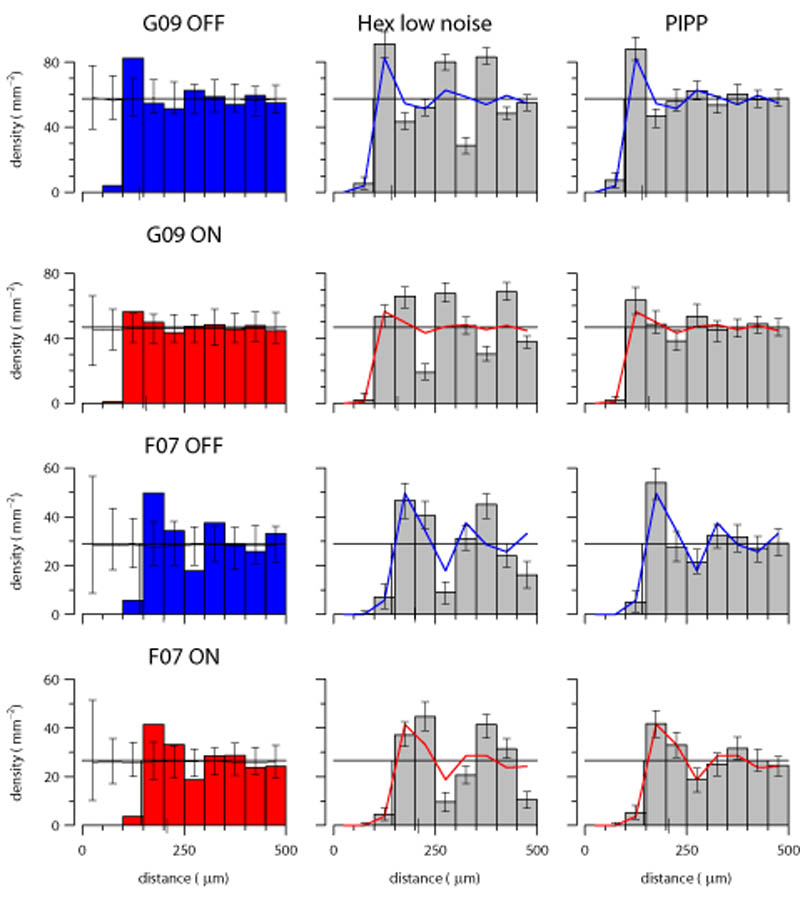
Figure 7.
Density recovery profiles for observed data, low noise hexagonal lattice and PIPP model. Left column: The DRP for each observed field; error bars denote 95% confidence intervals of 99 CSR fields of same density as observed field. Solid horizontal line shows the mean density of the observed field. Middle column: Each DRP bar denotes the mean density for 99 simulations of the observed data in left column (shown as solid line); error bars denote 95% confidence intervals of the simulations. The lattice model displays large fluctuations in density at increasing distances, which are absent in the data. Right column: Same as middle column, but using the PIPP model. There is good agreement between observed data and PIPP simulations.

