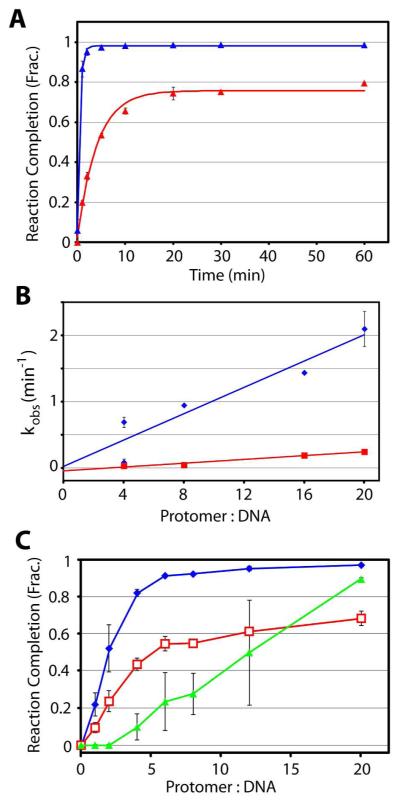
Figure 3. Genome End Maturation in Vitro is Limited by a Slow Strand Separation Rate.
Panel A. Time courses for the cos cleavage (blue) and strand separation (red) reactions in the presence of 100 nM terminase protomer. Each data point represents the average of at least three separate experiments with standard errors indicated (in some cases the error is smaller than the data point and is obscured). The solid line is the best fit of the data to a single exponential time course; derived kinetic parameters are reported in Table 1. Panel B. The observed rates of the cos-cleavage (blue) and strand-separation (red) reactions as a function of terminase protomer concentration. The data points at 4- and 20-fold excess terminase represent the average of three separate experiments with error bars indicated; the data points for 8- and 16-fold excess terminase are the result of a single experiment. Analysis of the data affords bi(molecular rate constants kon= (2.8 ± 0.5) × 105 M−1 sec−1) and kon= (0.43 ± 0.05) × 105 M−1 sec−1) for cos-cleavage and strand-separation, respectively. Panel C. Terminase Stoichiometry in the Maturation and Packaging Complexes. The extent of the cos-cleavage (blue), strand separation (red), and DNA packaging (green) reactions are shown as a function of increasing protomer concentration.

