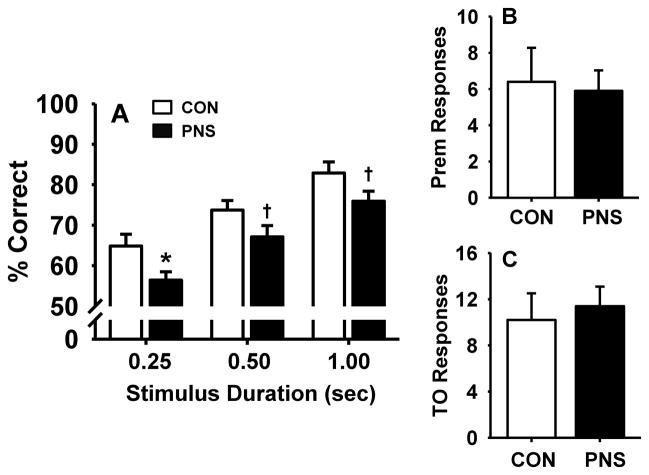
Fig. 3.
Effects of prenatal stress on performance of the 5C-SRTT with pseudorandom presentation of variable stimulus durations (VSD, 0.25, 0.50, and 1.00 second). (A) percent correct, (B) premature responses, or (C) timeout responses. Each bar represents the mean ± SEM for each test group.* represents a significant difference (p < 0.05) in performance between PNS and control rats, † represents a trend towards a significant difference (p < 0.10). PNS =prenatally stressed; CON = non-stressed controls. N = 10.

