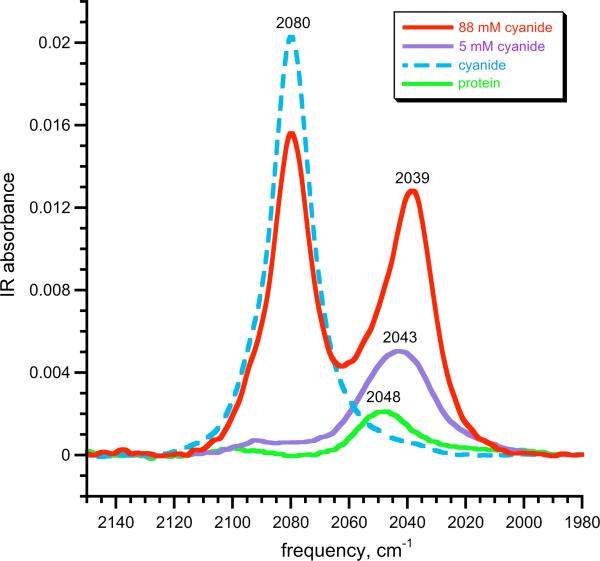
Figure 10.
FTIR spectra of solutions of 1.1 mM iron(II)-azurin in 25 mM MOPS buffer at pH 10, with addition of 5 mM (purple) and 88 mM (red) cyanide. For comparison, the spectra of iron(II) azurin (green) and cyanide (blue dashed) are overlaid on the spectrum. The peak at 2080 cm-1 is due to free cyanide. The peak at 2043 cm-1 at low [CN–] fits to the sum of two Lorentzian peaks (Figure S9), consistent with a superposition of the residual protein peak at 2048 cm-1 and the C-N stretching band of the cyanide adduct at 2039 cm-1.

