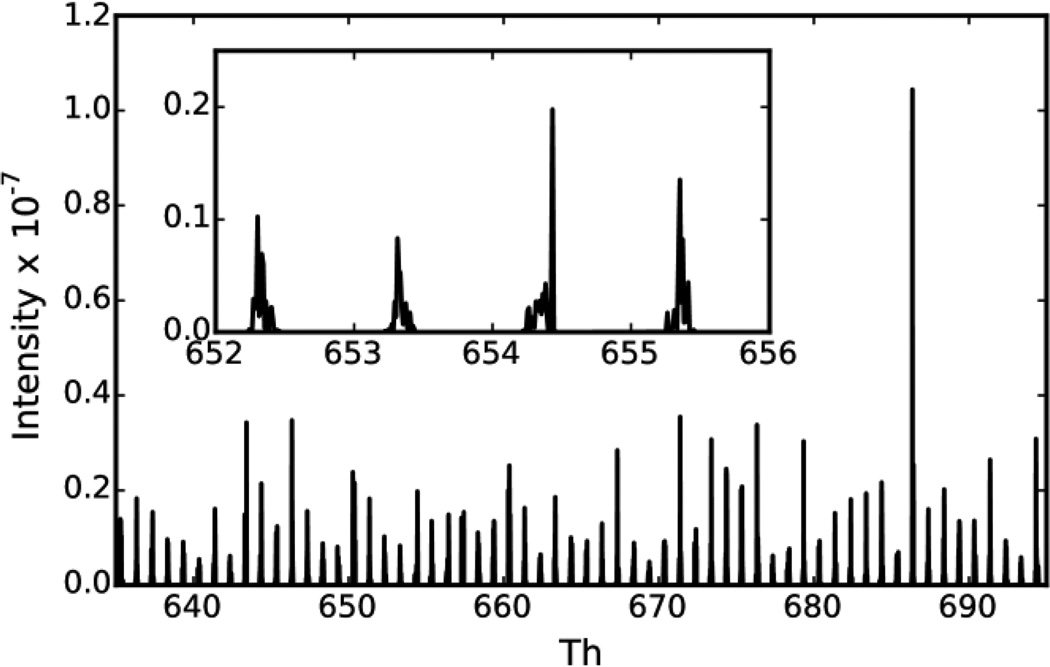
Figure 1. Theoretical fragment ion map.
The theoretical fragment ion map is plotted for m/z 635–695. The map was generated by summing over 100,000 fragmentation spectra. The peaks repeating every ~1.0005 m/z represent regions where a singly charged b or y-ion is theoretically likely to occur in a peptide fragmentation spectrum. The inset is a zoomed view of a subset of the fragment ion map. Notably, there are repeating regions in m/z-space where these peaks do not occur due to most peptides having a similar mass excess.

