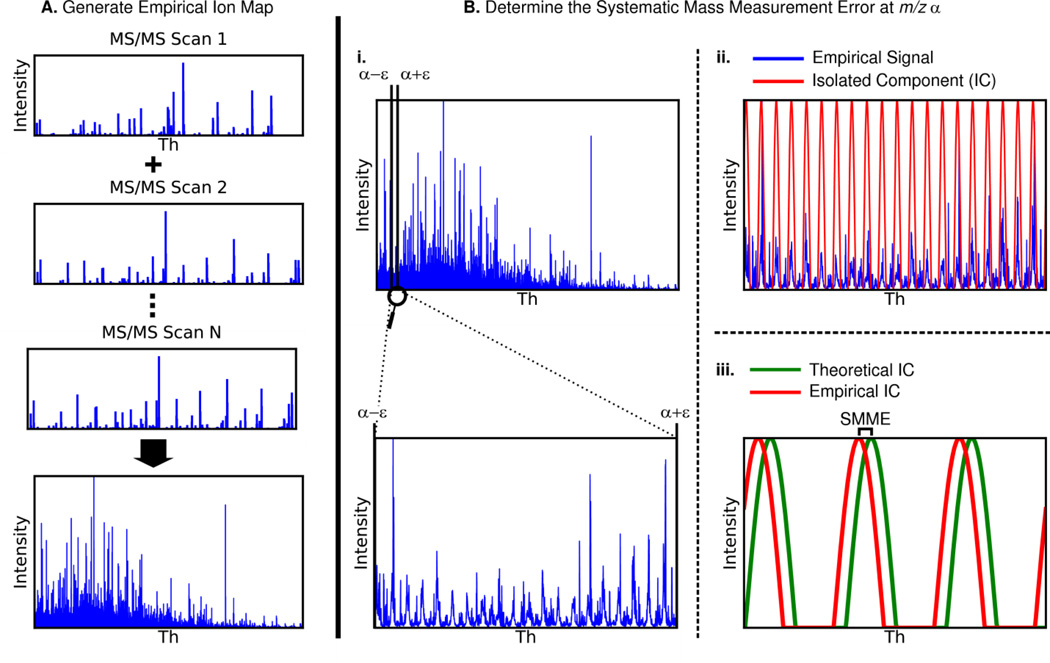
Figure 2. Steps for de novo calibration of MS/MS spectra.
A) All MS/MS spectra in the input file are binned and added to each other to generate an empirical fragment ion map for the file. This step only happens once for each file being calibrated. B) Systematic mass measurement error (SMME) is detected in 20 m/z intervals along the m/z range of the empirical fragment ion map.
- i) Analyze a slice of the empirical ion map with boundaries α +/− ε such that there is adequate signal for detection of SMME. The full empirical ion map (top) and a zoomed in slice of the empirical ion map (bottom) are shown.
- ii) Apply a discrete fast Fourier transform (DFFT) to this slice to isolate the frequency component of the signal with period 1.00045475 m/z (red). This isolated sinusoid component fits the observed peak clusters (blue).
- iii) Use the same technique as in steps i and ii to isolate the same frequency component from the theoretical ion map. The difference in phases of the empirical and theoretical frequency components is the systematic mass measurement error at m/z α.
Once SMME has been detected at each 20 m/z interval, use linear interpolation to determine the SMME at any m/z between these intervals.

