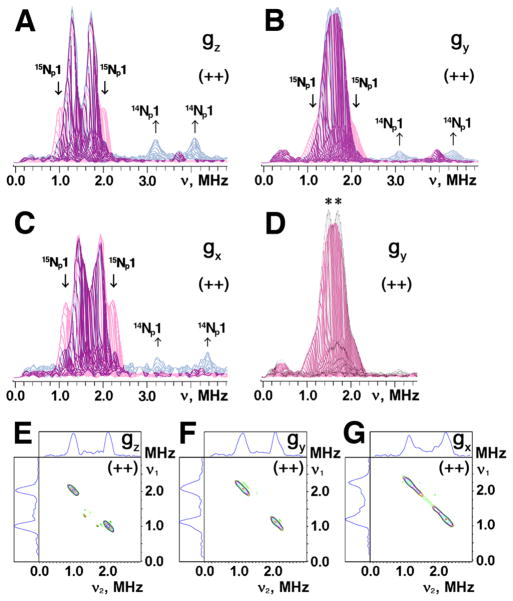
Figure 6.
Superimposed stacked HYSCORE spectra in the (++) quadrant of 14N(N/A) L-tyrosine (red) and 14N(N/A) L-lysine (blue) labeled ARF on the 15N-protein background (A–C), and their 15N difference (i.e. “14N(N/A) L-tyrosine labeled ARF” minus “14N(N/A) L-lysine labeled ARF”) HYSCORE spectra for 15Np1 cross-peaks in contour presentation (E–G), recorded near the gz (A,E), gy (B,F), and gx (C,G) areas at 10 K. Contribution of 15Np1 (with the isotropic hyperfine coupling a=1.03 MHz, Table 2) and 14Np1 for L-lysine to the nitrogen ESEEM amplitude in the (++) quadrant is evident for 14N L-tyrosine (red) and 14N L-lysine (blue) labeled ARF, respectively, when the stacked spectra (with zero projection angles) were re-scaled and superimposed after normalizing the relative scales of the cross-peak intensities from two Nδ(His) ligands in the (+−) quadrant (A–C).35 Similar approach was used to detect the possible contribution of 15N L-tyrosine (with a narrow splitting of ~0.2 MHz) to the 15N ESEEM amplitude in the (++) quadrant (marked with asterisks in (D)), when the stacked spectra of 14N L-tyrosine (red) and uniformly 15N-labeled35 (gray) ARF (with zero projection angles) were re-scaled and superimposed after normalizing the relative scales of the 15Nδ(His) cross-peak intensities in the (+−) quadrant (D). The same small τ-value (τ=136 ns; slightly exceeding the dead time of the instrument) was chosen for the measurement of these HYSCORE spectra, which allows the preferable observation of the undistorted lineshape of the cross-peaks as well as the minimization of the suppression effect on the ESEEM amplitudes.48 Magnetic field, and microwave frequency, respectively: 345.0 mT (near gz), 9.695 GHz (A,E); 365.5 mT (near gy), 9.695 GHz (B,F); 386.7 mT (near gx), 9.695 GHz (C,G); 363.1 mT (near gy), 9.695 GHz (D).

