
Figure 4.
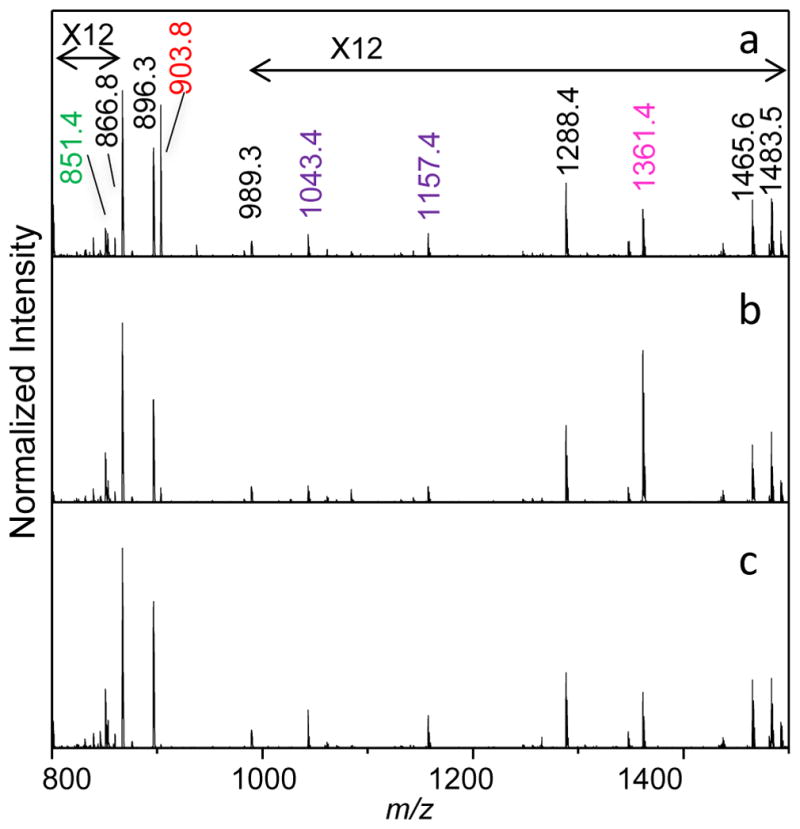
CID spectra of the mobility-selected ions at (a) 20.2, (b) 20.6, and (c) 21.0 ms. Unique fragments are labeled in colors (Figure 3) and non-specific fragments are shown in black. The m/z range has been narrowed (800 to 1500) for a closer comparison between the spectra.