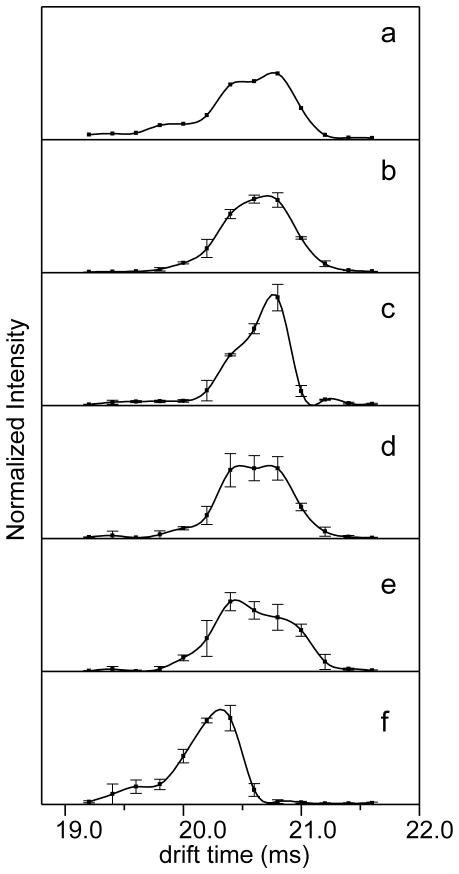
Figure 5.
(a) Ion mobility distribution of the precursor ions (m/z = 1006.0). XFIDTDs obtained from (b) the non-specific fragment ions (m/z = 866.8) and the specific fragments at m/z (c) 1361.4, (d) 851.4, (e) 1043.4, and (f) 903.8 for the D1/C13D13, D1/D2, D2/D3 and C13D13 isomers, respectively. The distributions represent the averages of three data sets with the error bars representing the standard deviation at each drift time. These distributions are observed by integrating all drift bins over a narrow range (centered about the m/z values given above) for each drift time selection.

