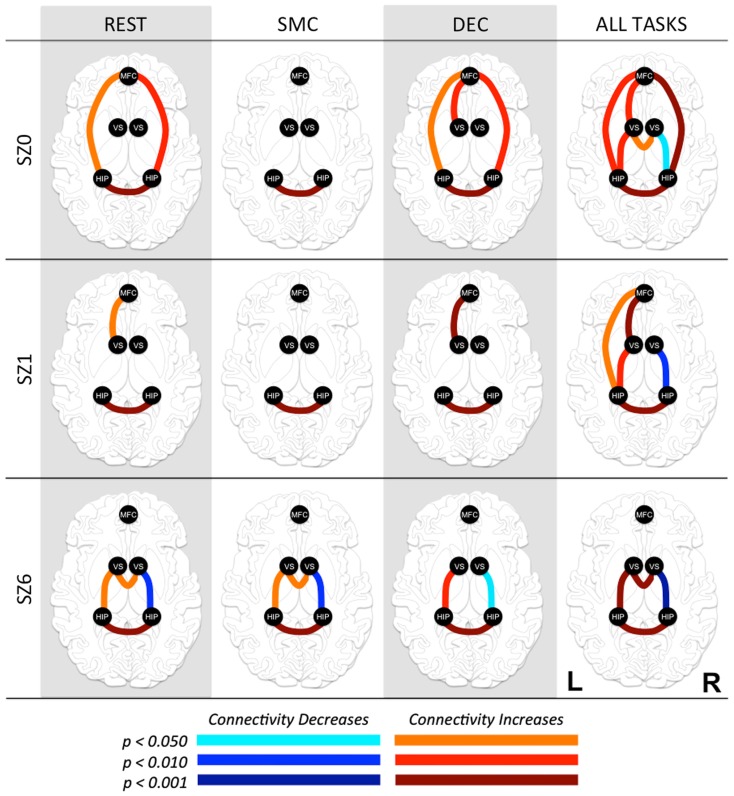
Figure 3.
Functional connectivity between regions of interest (ROI) at three time points in antipsychotic drug treatment (vertical axis) while performing three tasks and combined for all tasks (horizontal axis). Graph nodes represent ROI; graph edge color indicates the significance of the connection between nodes (p-value), for all connections with p < 0.05. SZ0, baseline; SZ1, 1 week of antipsychotic drugs treatment; SZ6, 6 weeks of antipsychotic drug treatment; HIP, hippocampus; VS; ventral striatum/nucleus accumbens; MFC, medial frontal cortex.

