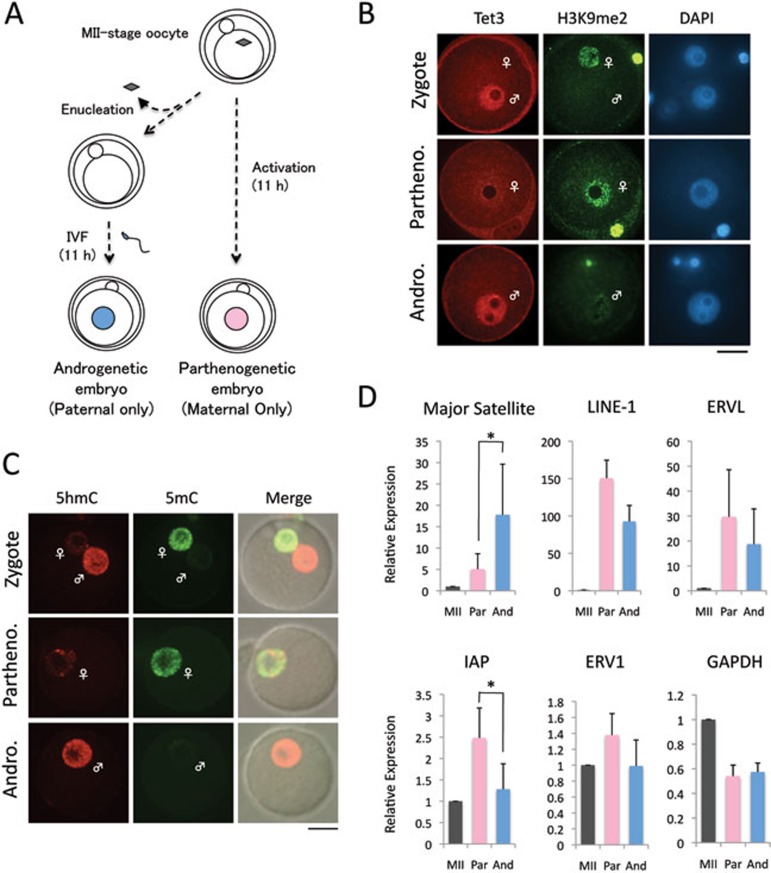
Figure 2.
Expression of TEs in parthenogenetic and androgenetic 1-cell embryos. (A) Experimental scheme for generating parthenogenetic and androgenetic 1-cell embryos. Androgenetic embryos were produced by in vitro fertilization of enucleated MII-stage oocytes. Parthenogenetic embryos were generated by artificial activation with strontium. Embryos were collected 11 h after insemination or activation. (B) Representative images of zygotes, parthenogenetic (Partheno) and androgenetic (Andro) embryos co-stained with Tet3 (red) and H3K9me2 (green) antibodies. H3K9me2 marks the maternal pronucleus. Scale bar = 20 μm. (C) Representative images of zygotes co-stained with 5hmC (red) and 5mC (green) antibodies. More than six embryos were examined in each group. (D) RT-qPCR analysis of the expression of TEs in parthenogenetic (Partheno) and androgenetic (Andro) 1-cell embryos. The relative expression level was normalized to an external control. The values of MII-stage oocytes were set as 1. The experiments were repeated for 3 times. Error bars indicate standard deviations. * represents statistical significance (P < 0.05).

