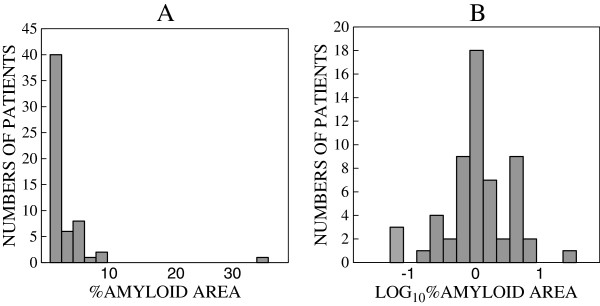
Figure 1.
Histogram showing distribution between numbers of patients and %amyloid area.A: Distribution between numbers of patients and %amyloid area. Fifty-seven out of 58 patients of %amyloid area were under 10%. Forty out of 58 patients were under 2%. B: Distribution between numbers of patients and log10%amyloid area. The distribution was similar to normal probability distribution.

