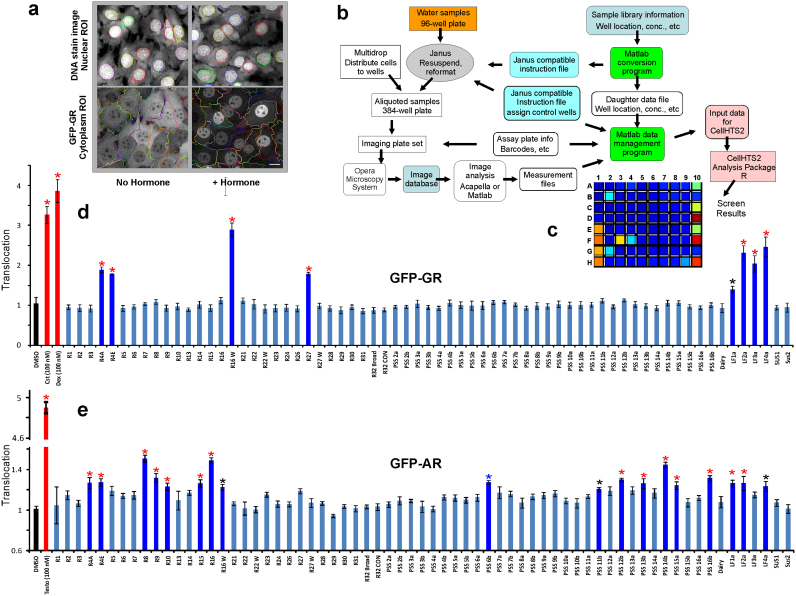
Figure 2. Water sample screening by high throughput automated image analysis.
(a) Examples of images scored for cytoplasmic and nuclear segmentation from control and corticosterone treated 3617 cells. (b) Workflow for image-based screening of environmental contaminants with glucocorticoid activity using the Perkin Elmer Opera Image Screening System. (c) Automated image analysis output for a representative experiment. In this series, eight water samples from a total of 69 (well positions 2B, 2G, 3F, 4F, 9H, 10A, 10C, and 10E corresponding to samples R4E, R4A, R16W, R27, LF1a, 2a, 3a, and 4a (d, see below) tested positive for GFP-GR translocation as indicated by color changes. Wells 1A–D represent four negative (DMSO) controls. Wells 1E–H are positive controls for cells treated with 100 nM corticosterone, and wells 10D, 10F and 10H are positive controls for cells treated with 100 nM dexamethasone. (d) and (e) Quantitative analysis for GFP-GR and GFP-AR nuclear translocation, respectively. Translocation was calculated as a ratio of the nuclear versus cytoplasmic intensity, and each value was normalized to the control. Samples positive for glucocorticoid activity are marked with asterisks (P<0.01, red asterisks and P<0.05, black asterisks). Error bars represent the mean value ± s.e.m, n = 4.

