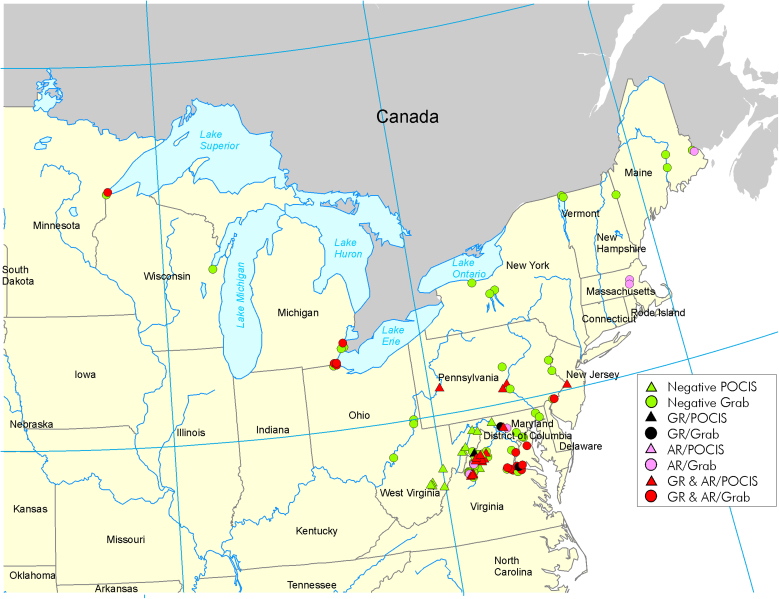
Figure 3. Geographic locations of the collection sites and their contamination with glucocorticoid and androgenic activity.
Negative samples are marked with green color. Samples positive for glucocorticoid activity are marked with black, androgen activity-positive samples are marked with pink, and samples positive for both activities are marked with red. Triangles indicate grab samples, while the circles indicate the use of POCIS membranes. For complete sample description (collection method as well as the time of collection and translocation activity) see Supplementary Tables S4a and b.

