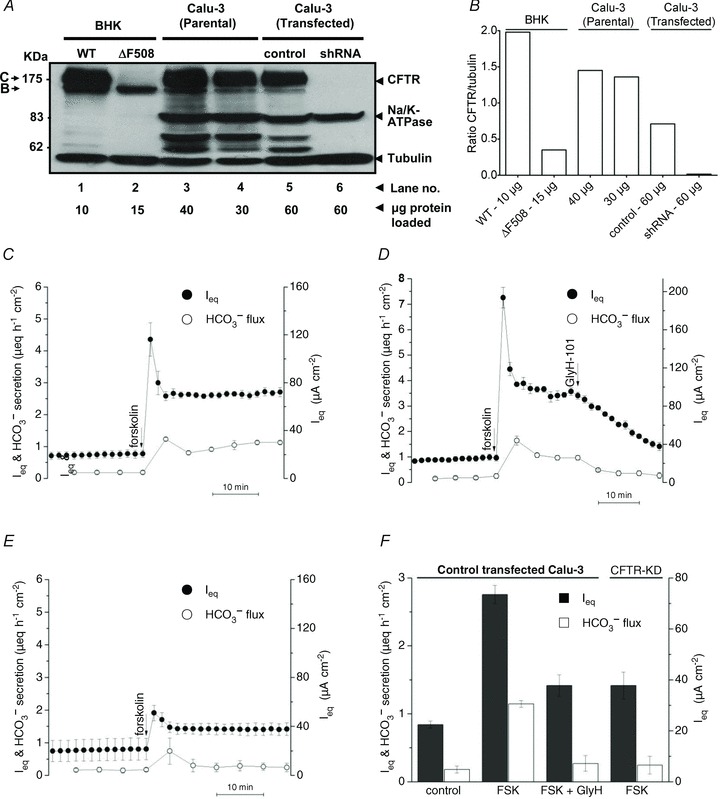
Figure 2. CFTR expression and HCO3− secretion.

A, CFTR expression in stable cell lines. Lane 1, baby hamster kidney (BHK) cells transfected with wild-type CFTR expressed both mature and immature CFTR. Lane 2, BHK cells transfected with ΔF508 CFTR expressed only immature (band B) CFTR. Lanes 3 and 4, parental, and Lane 5 control transfected Calu-3 cells also expressed both bands B and C. Lane 6, CFTR was not detectable in shRNA knock-down cells. Comparisons of band intensities and μg protein loaded indicate the following relative expression levels: BHK ≫ Calu-3 (Parental) > Calu-3 (control transfected) ≫ Calu-3 (shRNA transfected). This blot is representative of two experiments. B, mean densities of CFTR normalized to tubulin (n= 2). C, forskolin (10 μmol l−1) stimulated Ieq and HCO3− secretion across wild-type Calu-3 cells under open-circuit conditions (n= 12). D, CFTR inhibitor GlyH-101 (100 μmol l−1) nearly abolished forskolin-stimulated Isc and HCO3− secretion (n= 6). E, the forskolin response was greatly reduced in CFTR-knock-down Calu-3 cells (n= 6). •, Ieq; •, HCO3− secretion. F, summary of forskolin-stimulated Ieq (filled bars) and HCO3− secretion (open bars) shown in C, D and E. Means ± SEM.
