
Figure 4. Basal and FSK-stimulated duodenal and mid-colonic HCO3− secretion ( ) in anaesthetized mice.
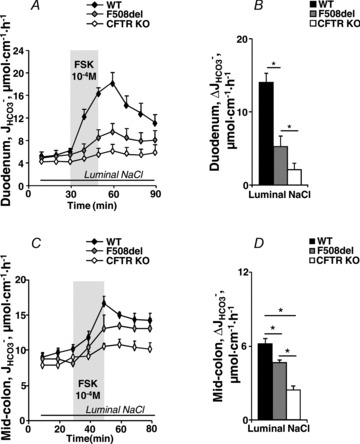
Time course (A and C) and magnitude of HCO3− secretory response (B and D) in luminally perfused duodenum (A and B) and mid-colon (C and D) of anaesthetized WT, F508del and CFTR KO mice. FSK-induced  was significantly different in luminally perfused duodenum and mid-colon between each genotype. *P < 0.05; n= 5.