
Figure 8. Western blot and streptavidin pull-down.
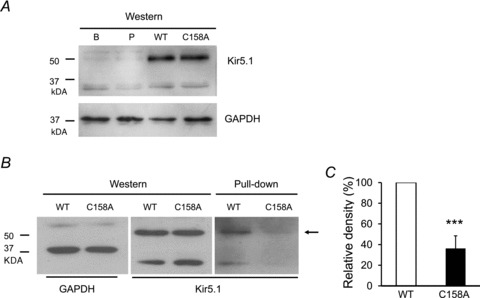
A, Western blot showing Kir4.1–Kir5.1 protein expression in the HEK cells expressing wild-type Kir4.1–Kir5.1 (WT), mutant Kir4.1–Kir5.1 (C158A), pcDNA3.1 vector (P) and non-transfected HEK cells (B) (upper). GAPDH is loading control (down). B, Western blot showed a similar density in reaction with anti-Kir5.1 antibodies (middle) with GAPDH loading control (left). After pull-down under the same experimental condition, a clear ∼50 kDa band indicated by the arrow (right) was seen with WT Kir5.1. In comparison, the density of the Kir5.1 (C158A) mutant was much weaker. C, the band densities of pull down were compared between WT and Kir5.1 (C158A) mutant after normalization of the WT Kir5.1 as 100%. The Kir5.1 (C158A) mutation lowered the band density by 74 ± 12% (n= 7 experiments; ***P < 0.001; Student's t test).